


Century 21 People’s Choice Realty Inc., Brokerage
120 MATHESON BLVD E #103
MISSISSAUGA, Ontario
L4Z 1X1


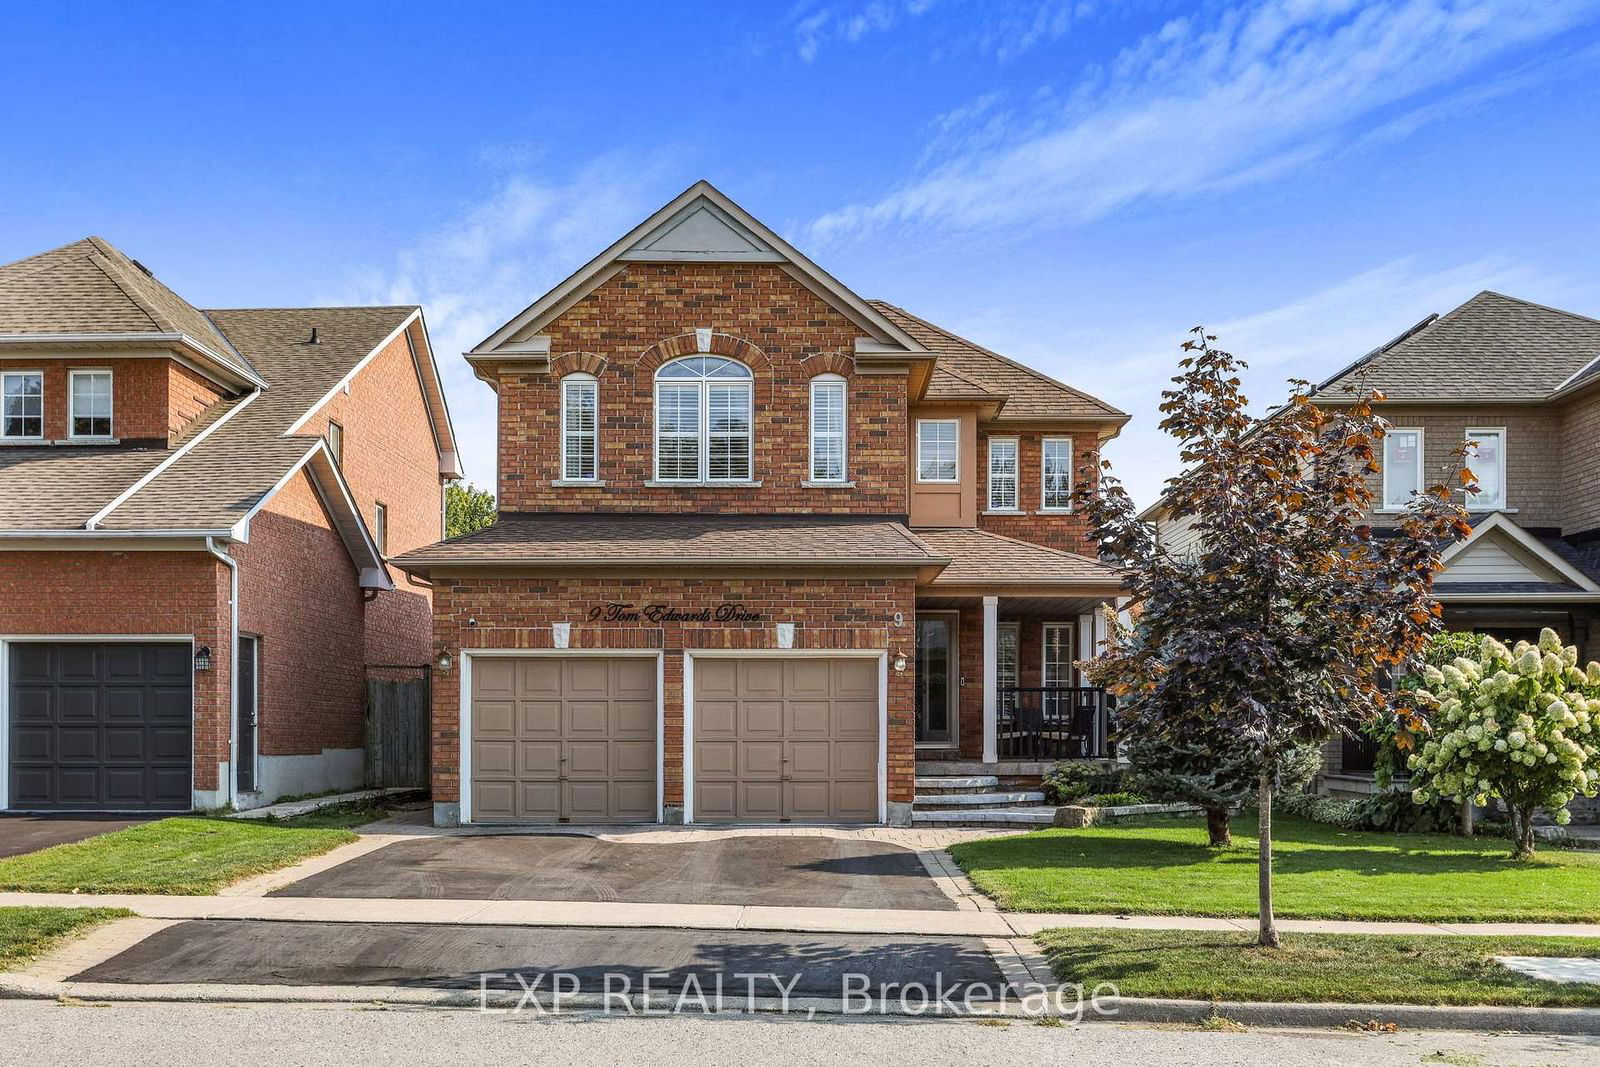
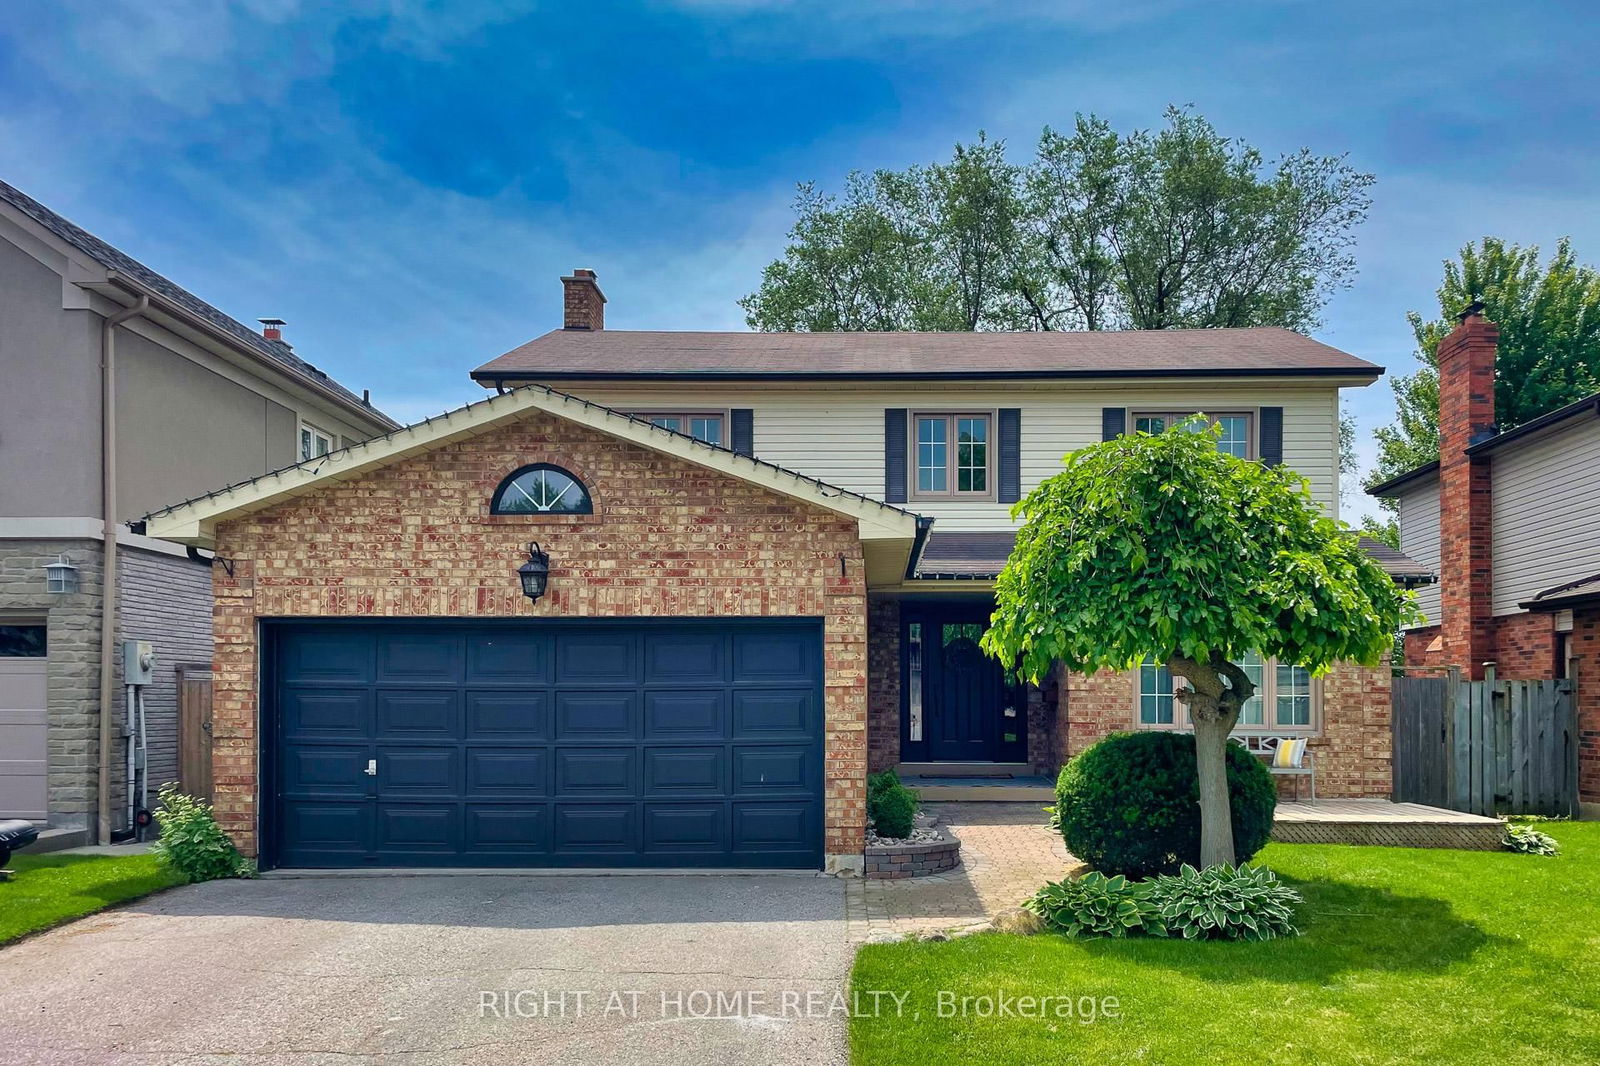
Whitby, Rolling Acres, L1R 1V9
$1,088,000
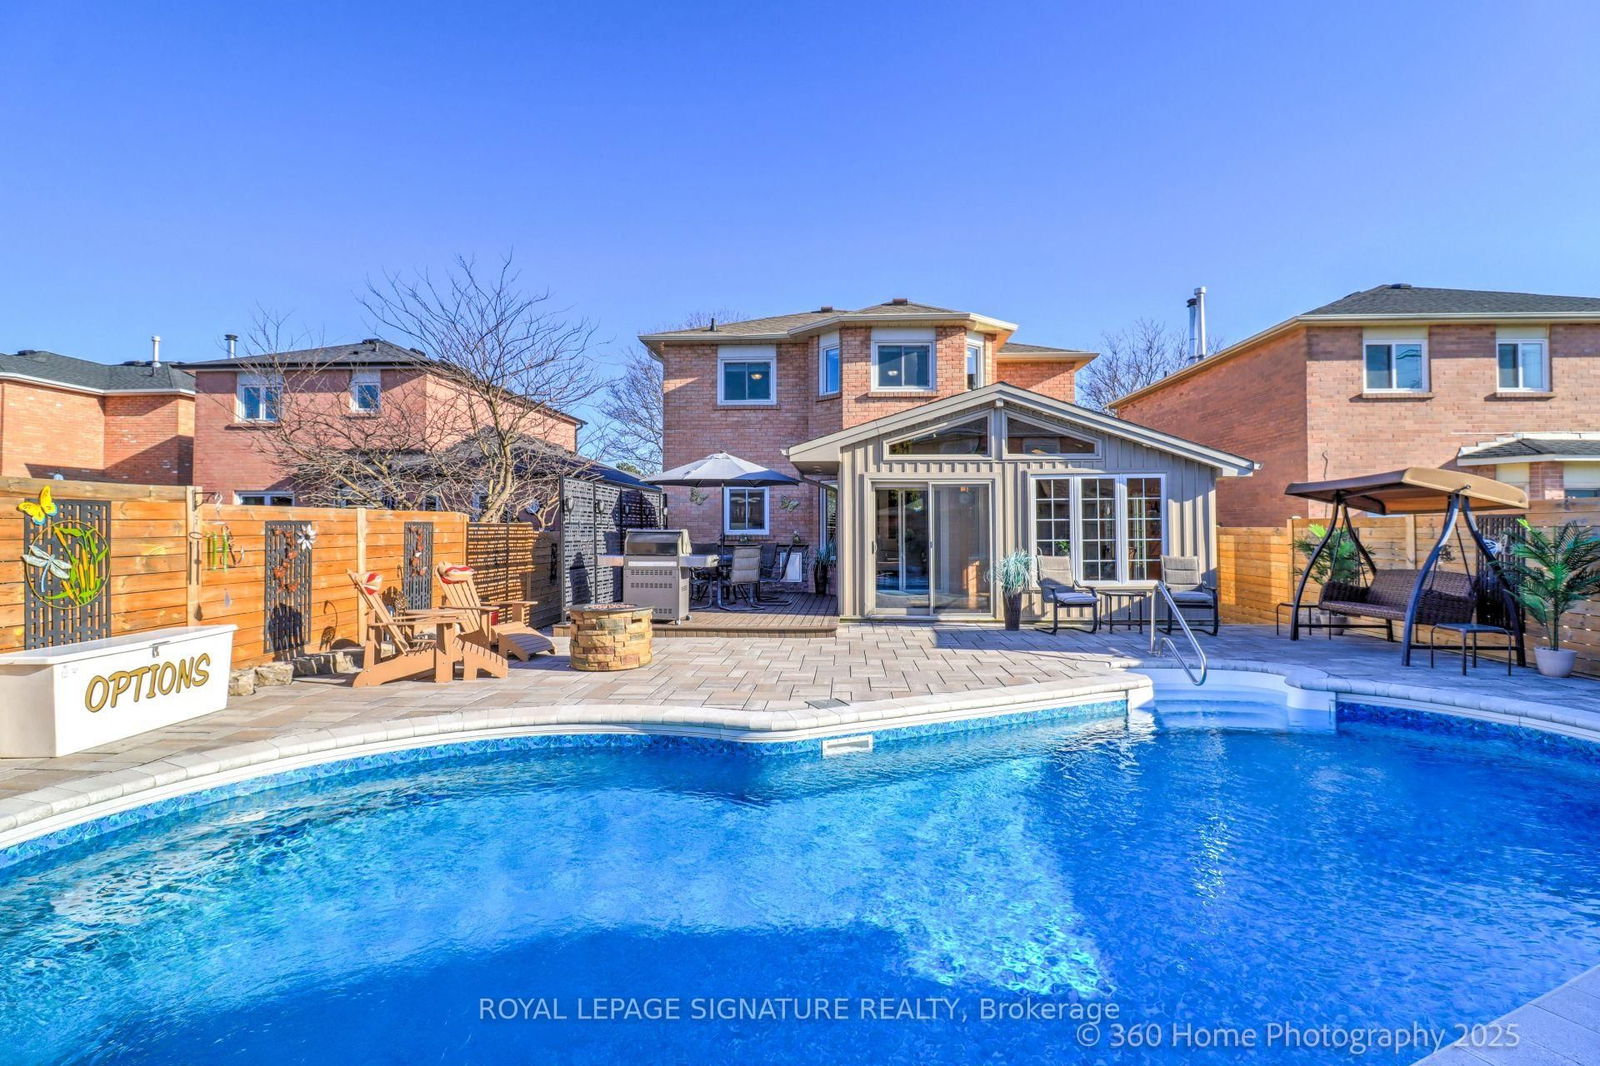
Listed by ROYAL LEPAGE SIGNATURE REALTY.
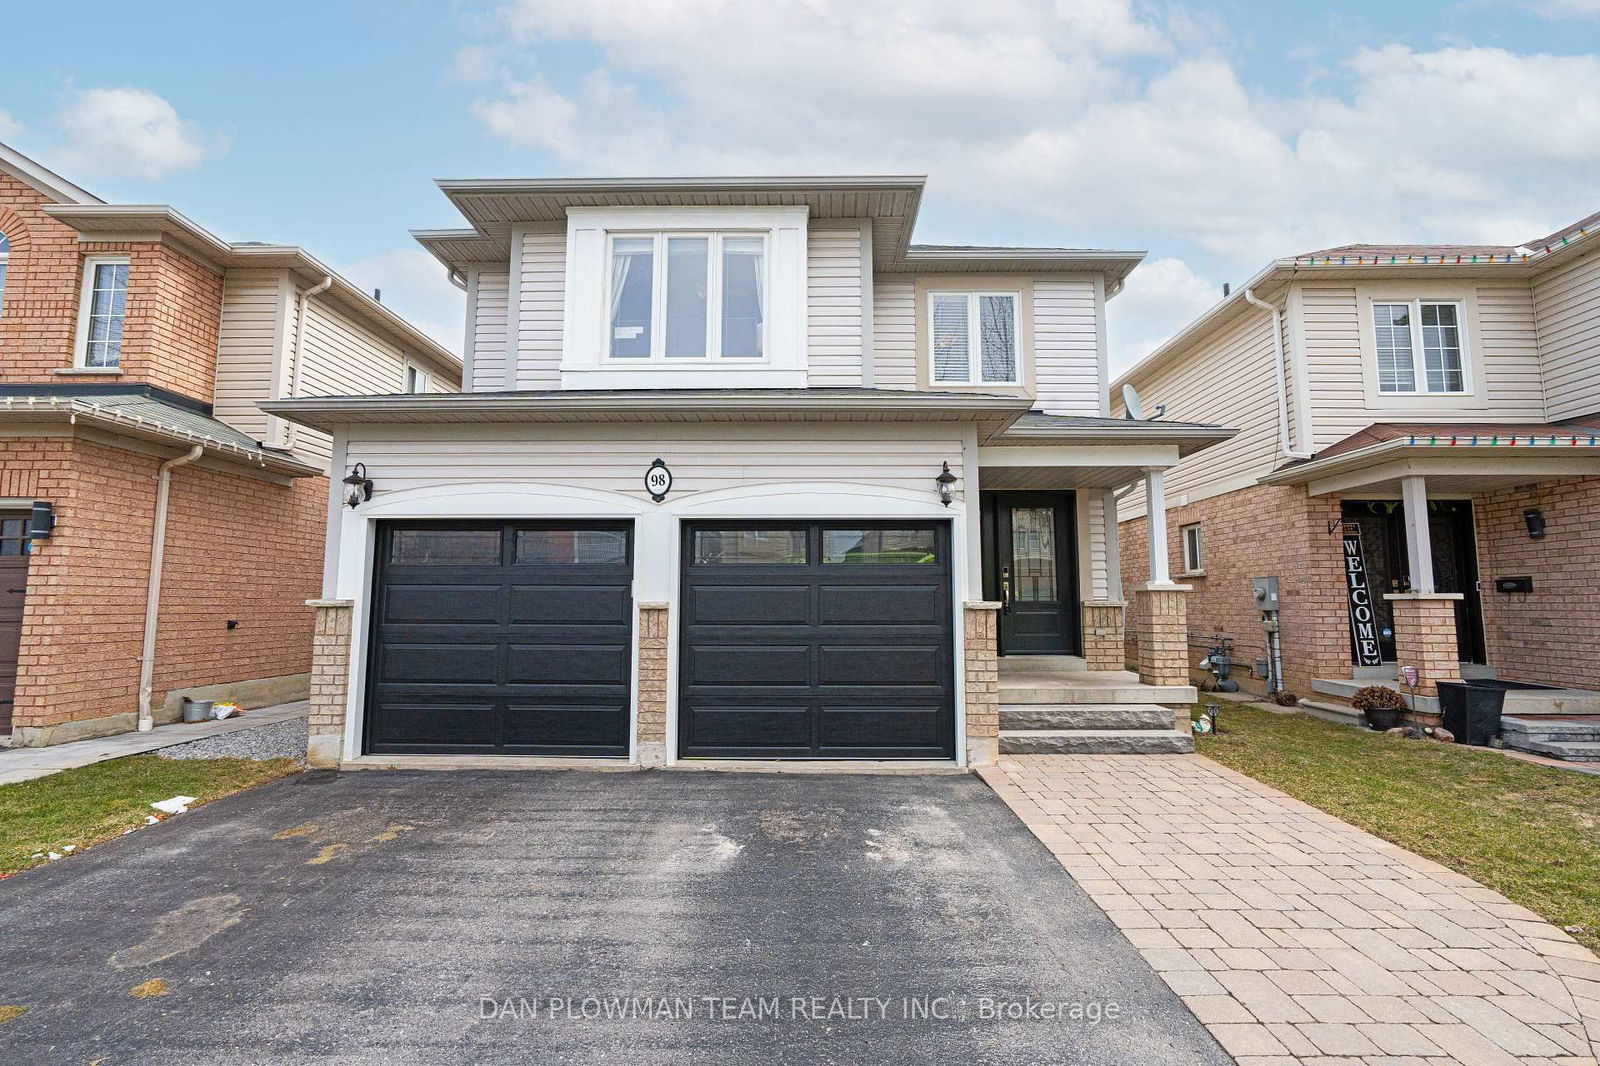
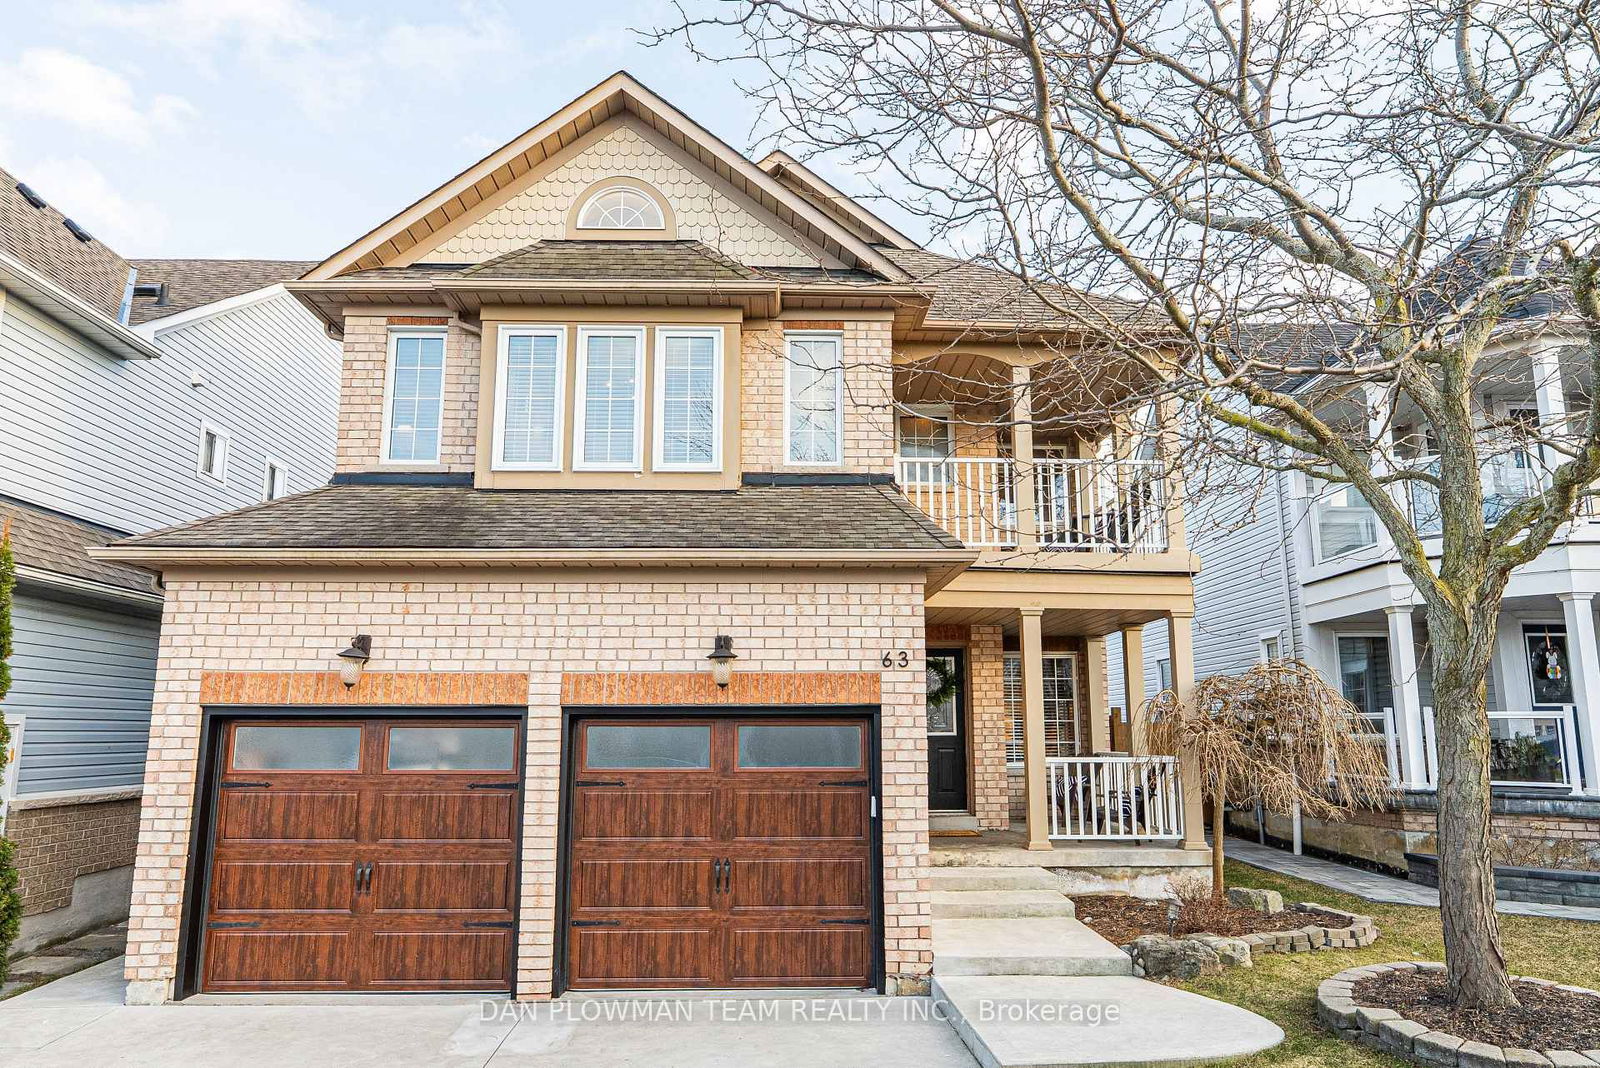
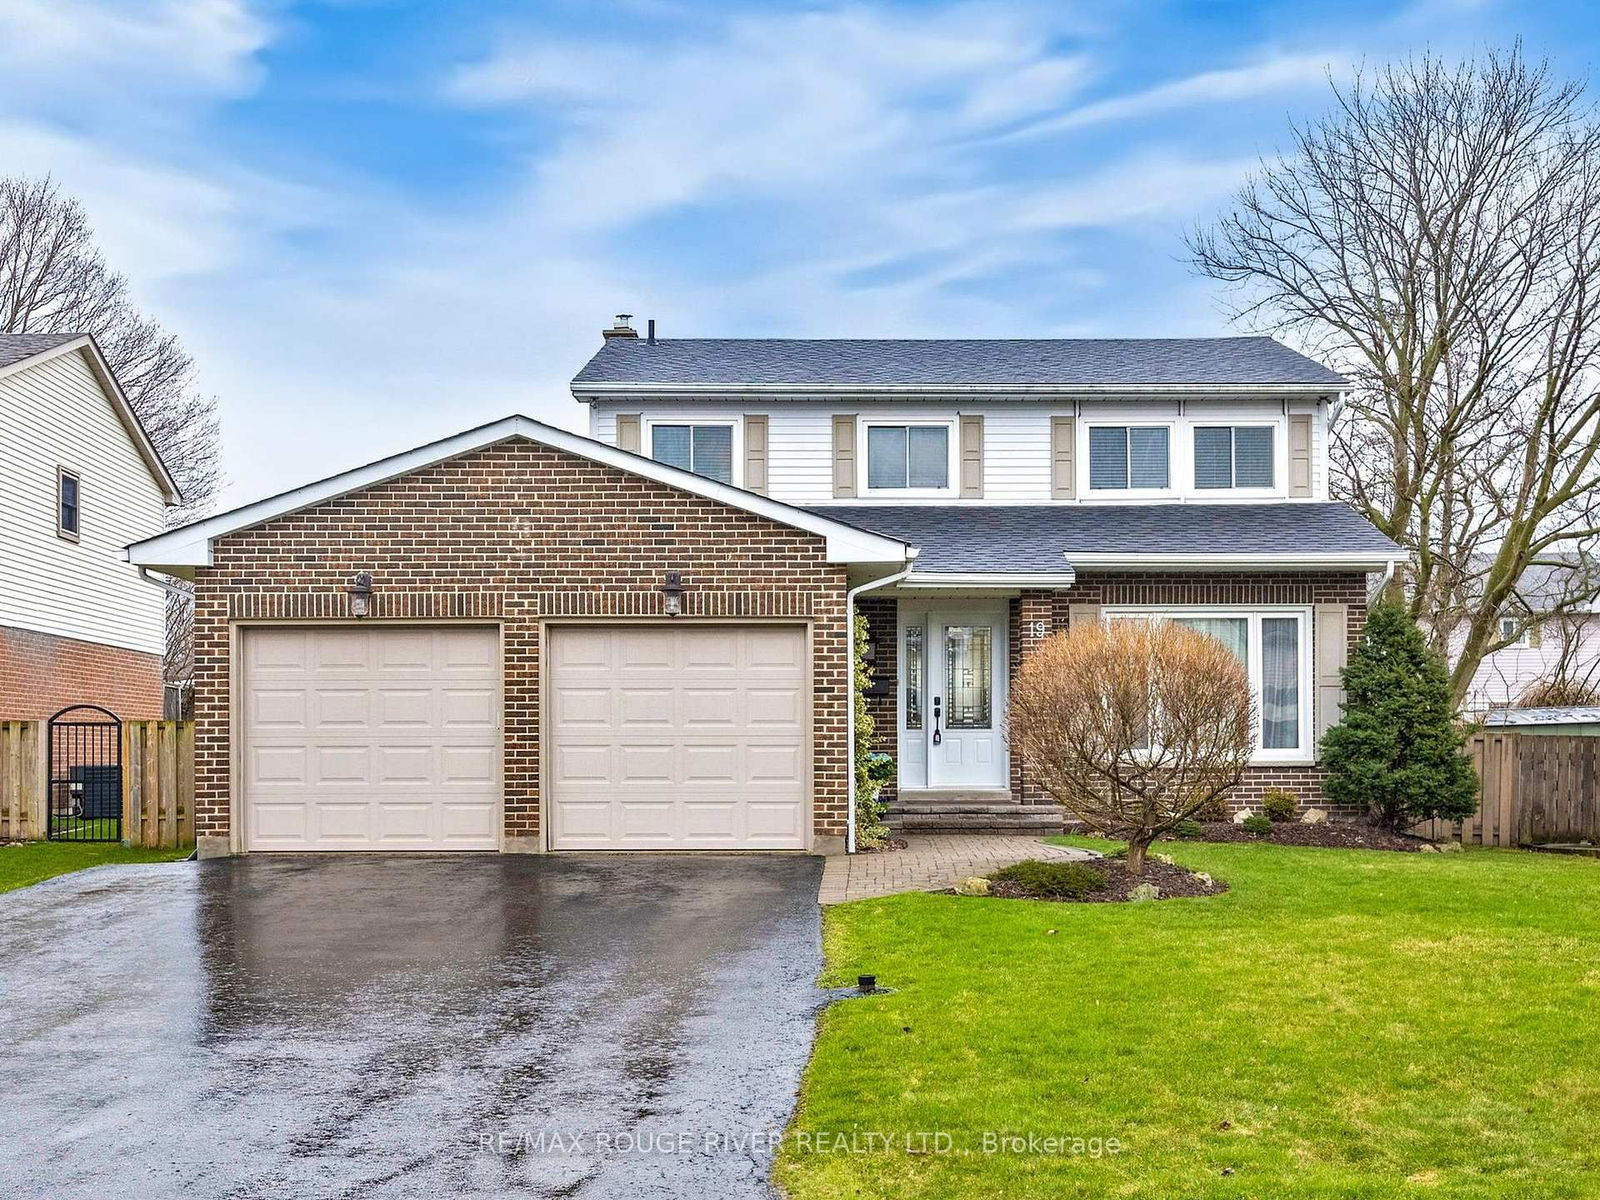
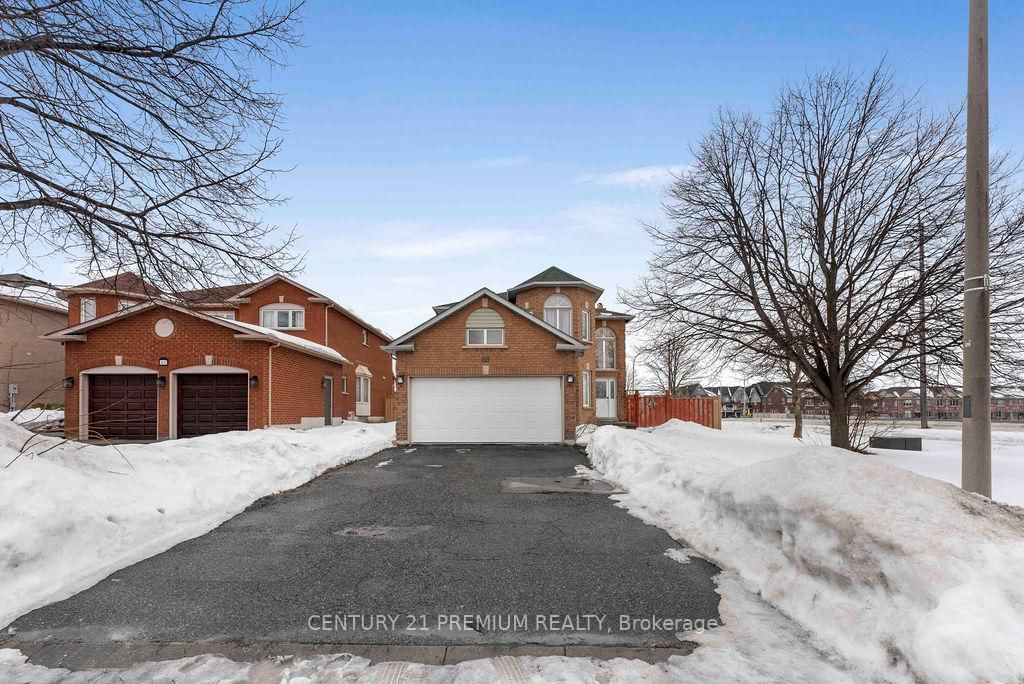
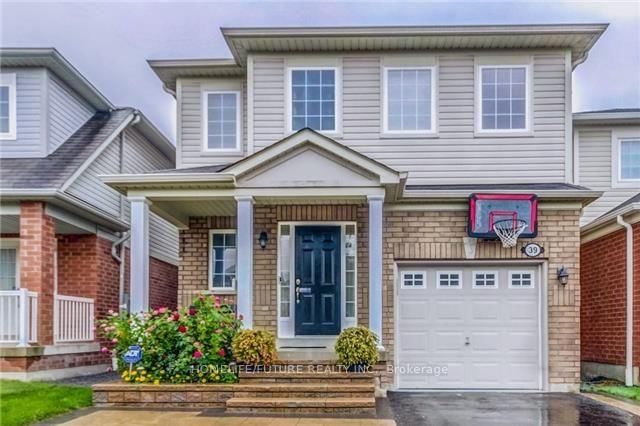
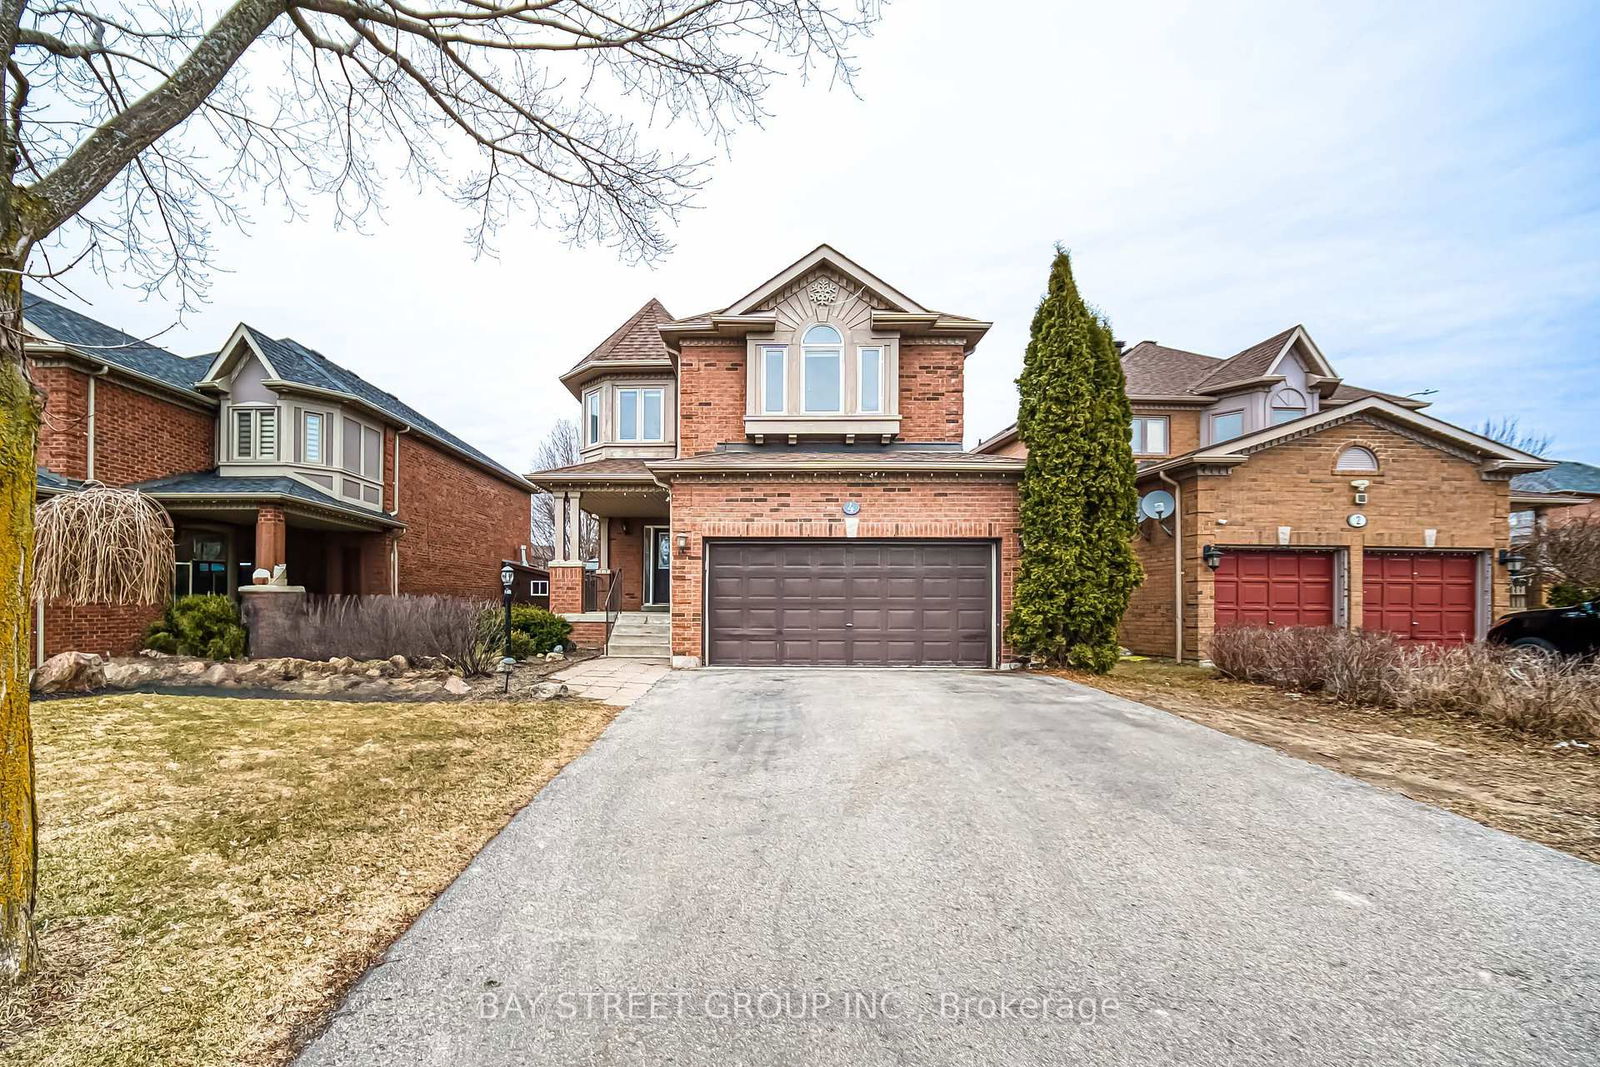
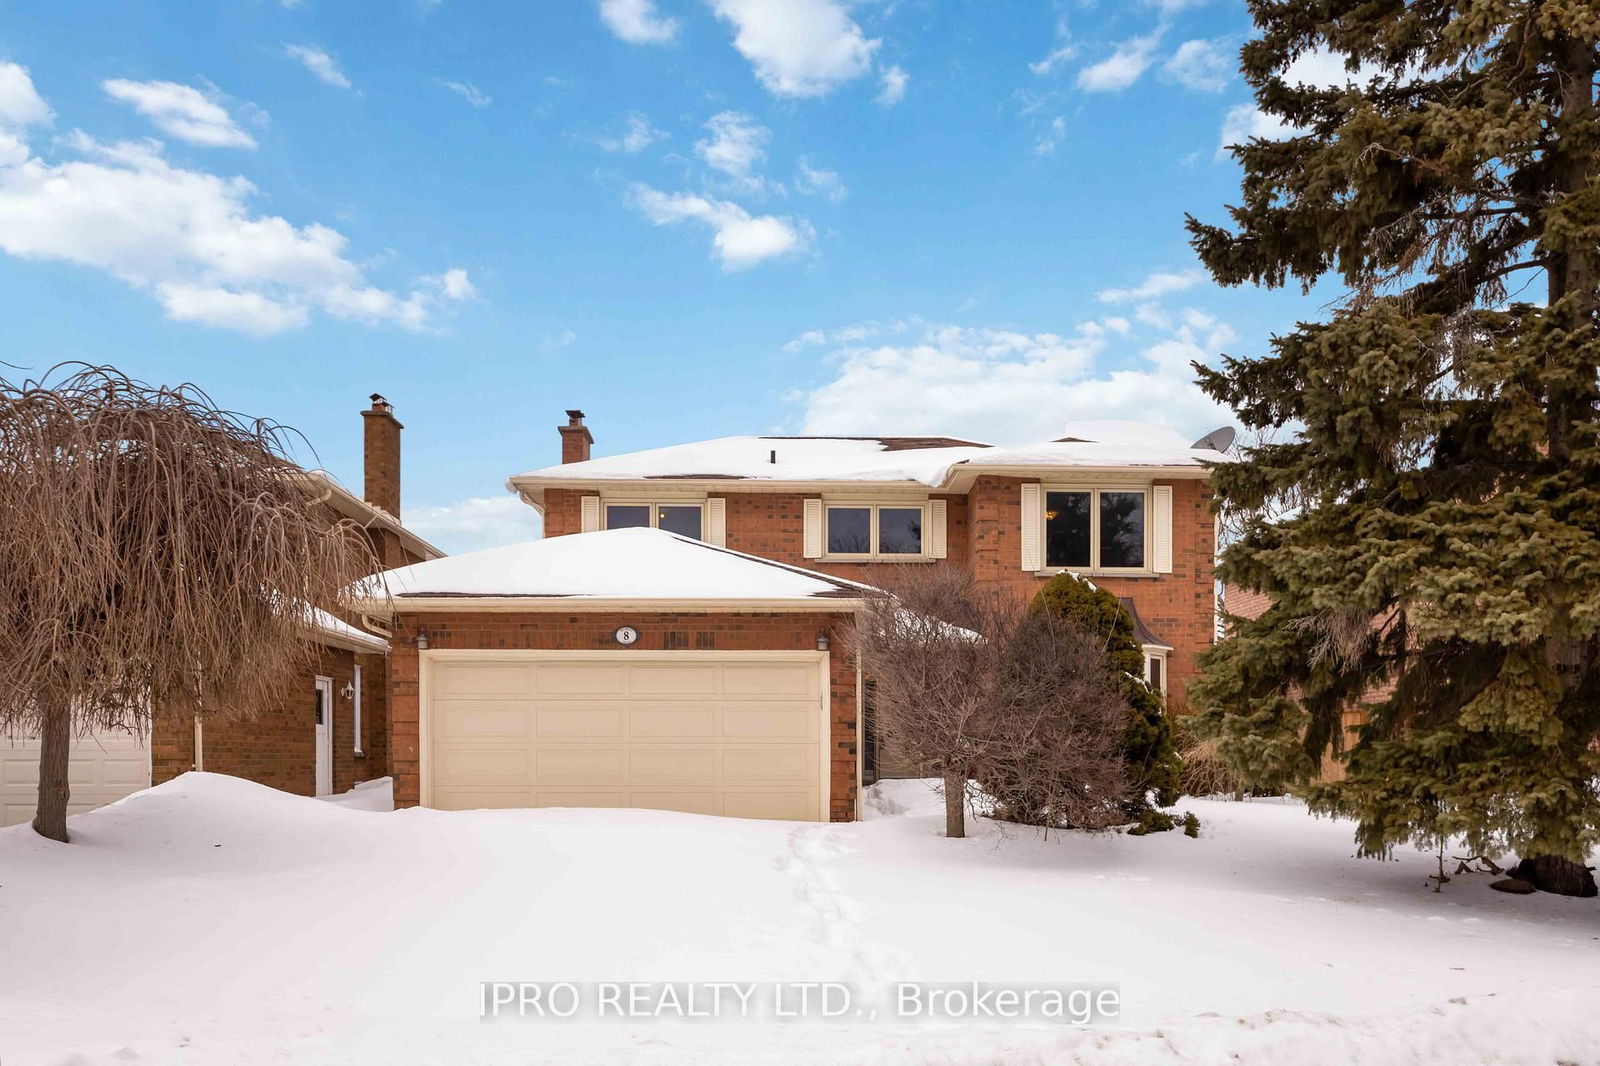
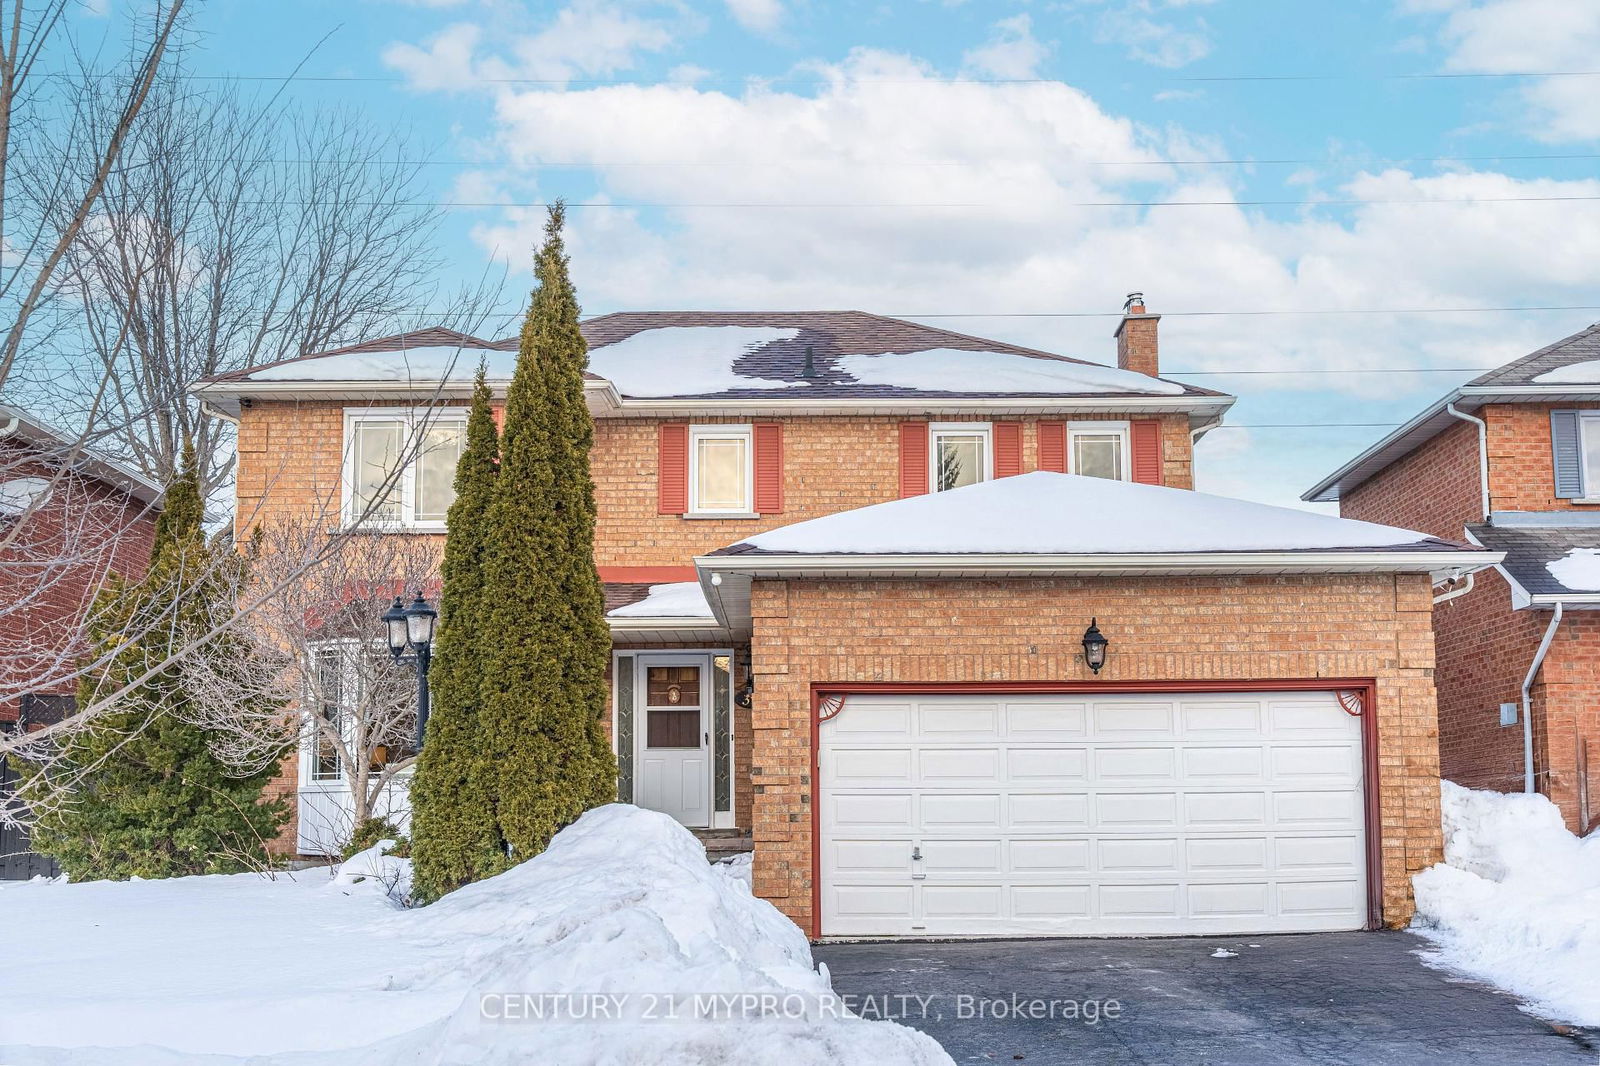
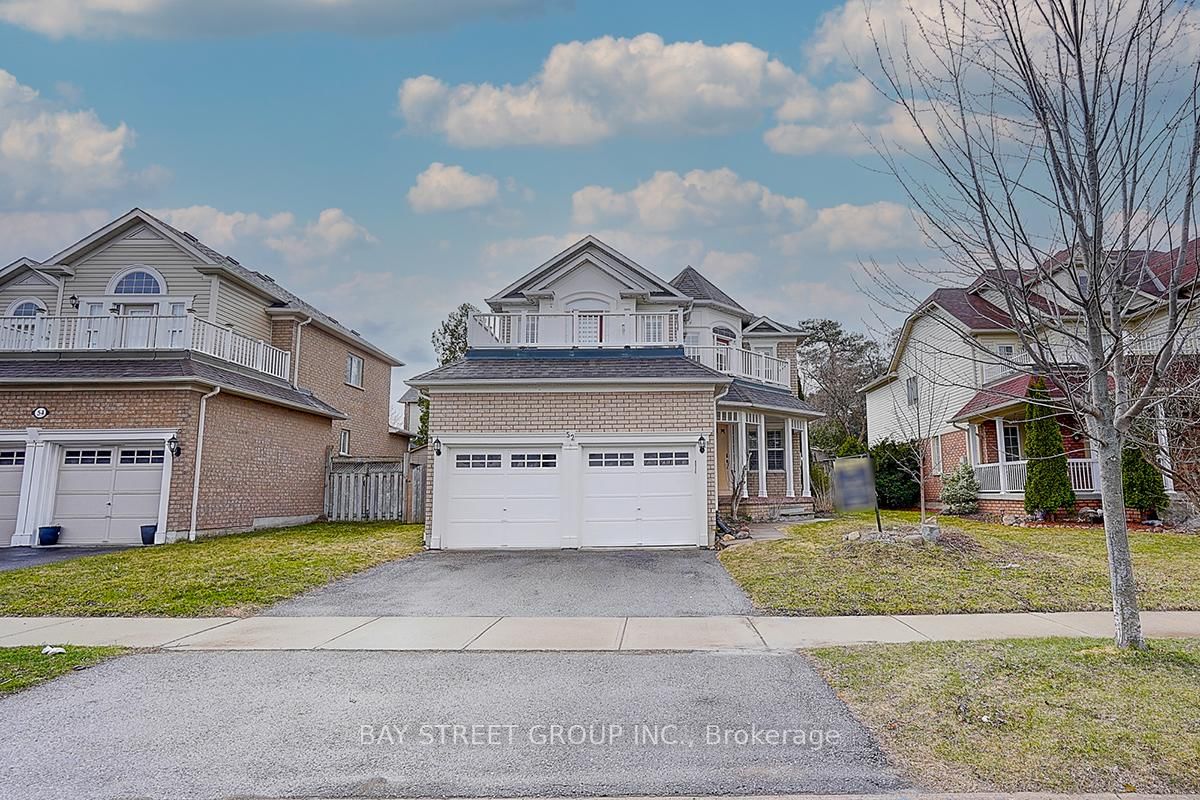
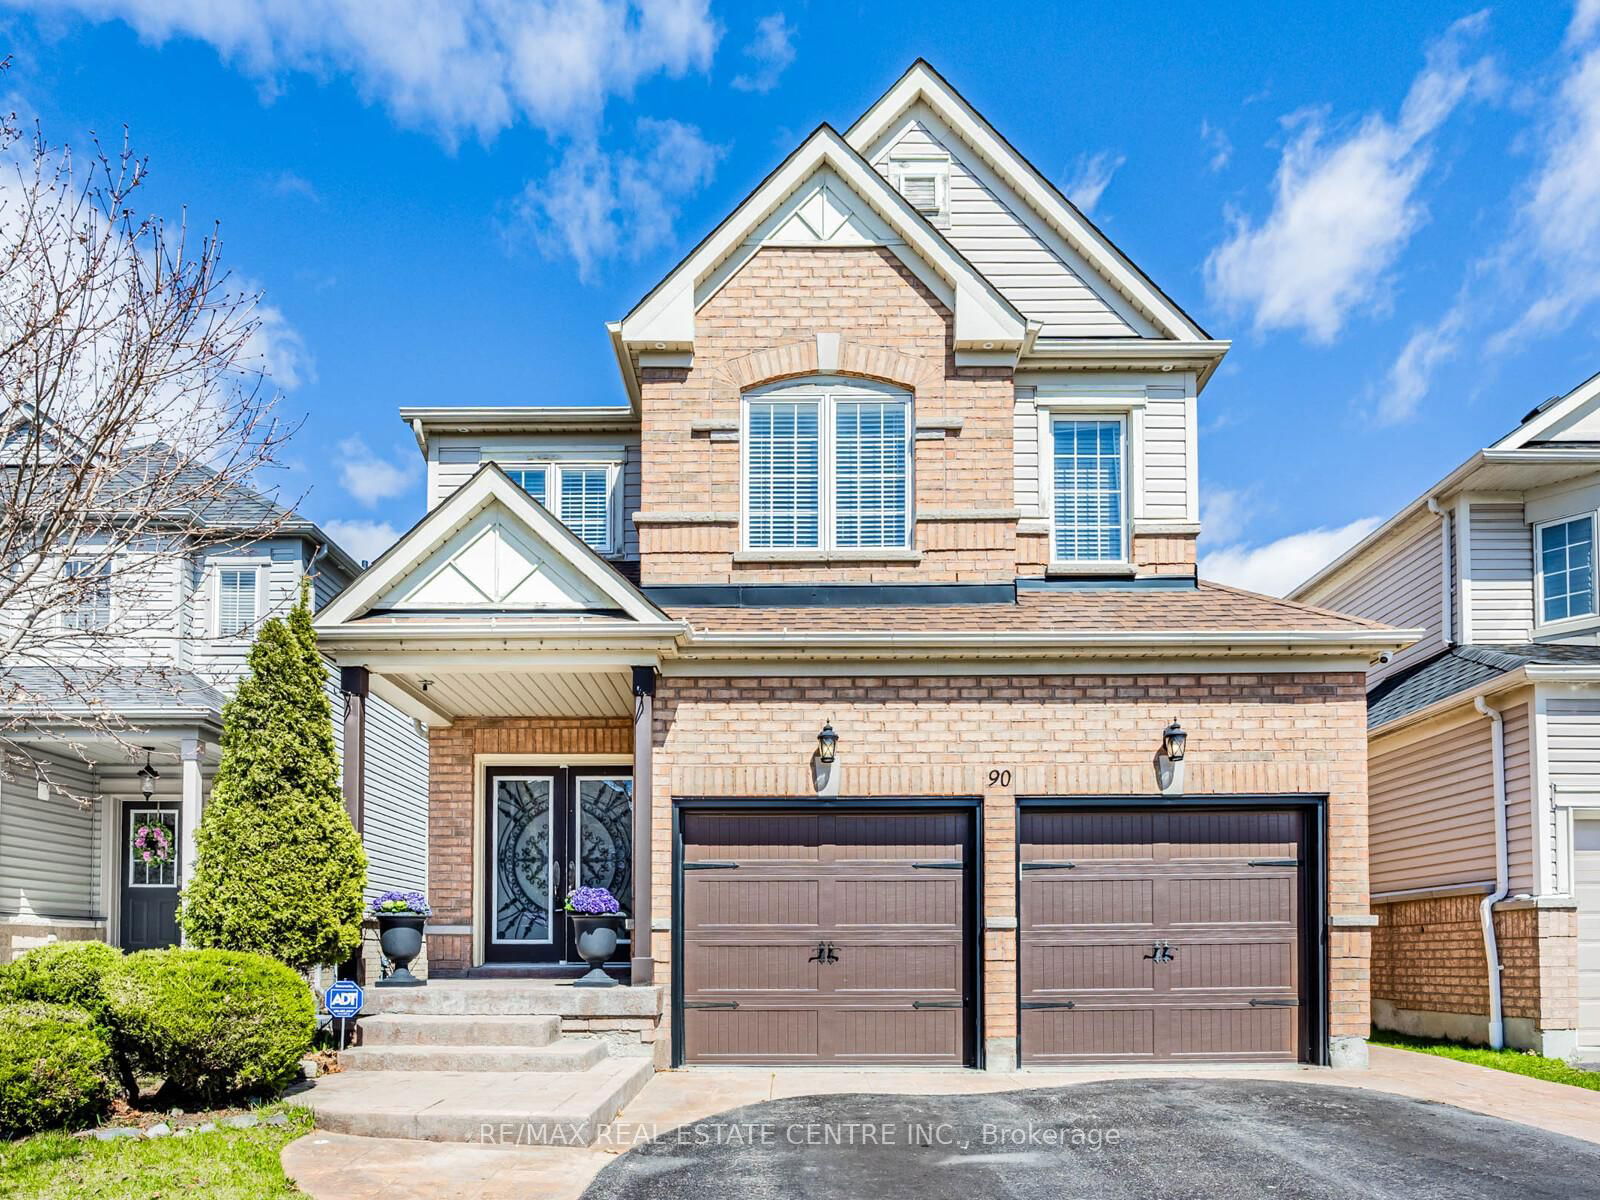
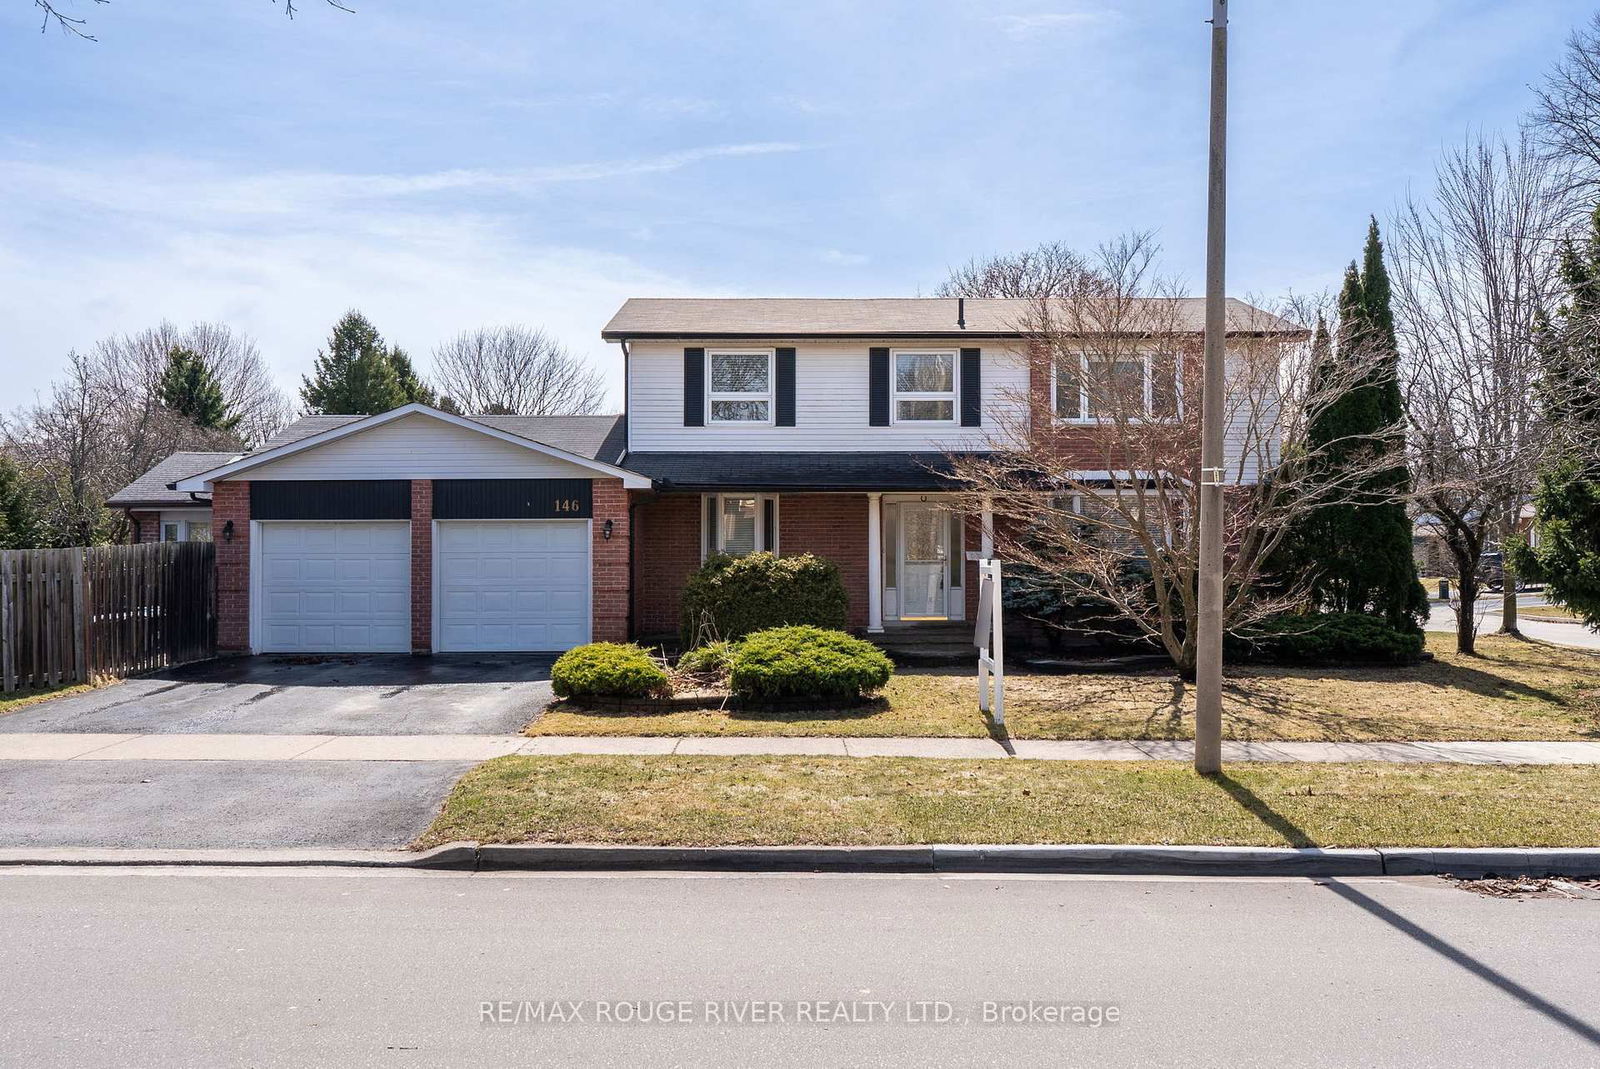
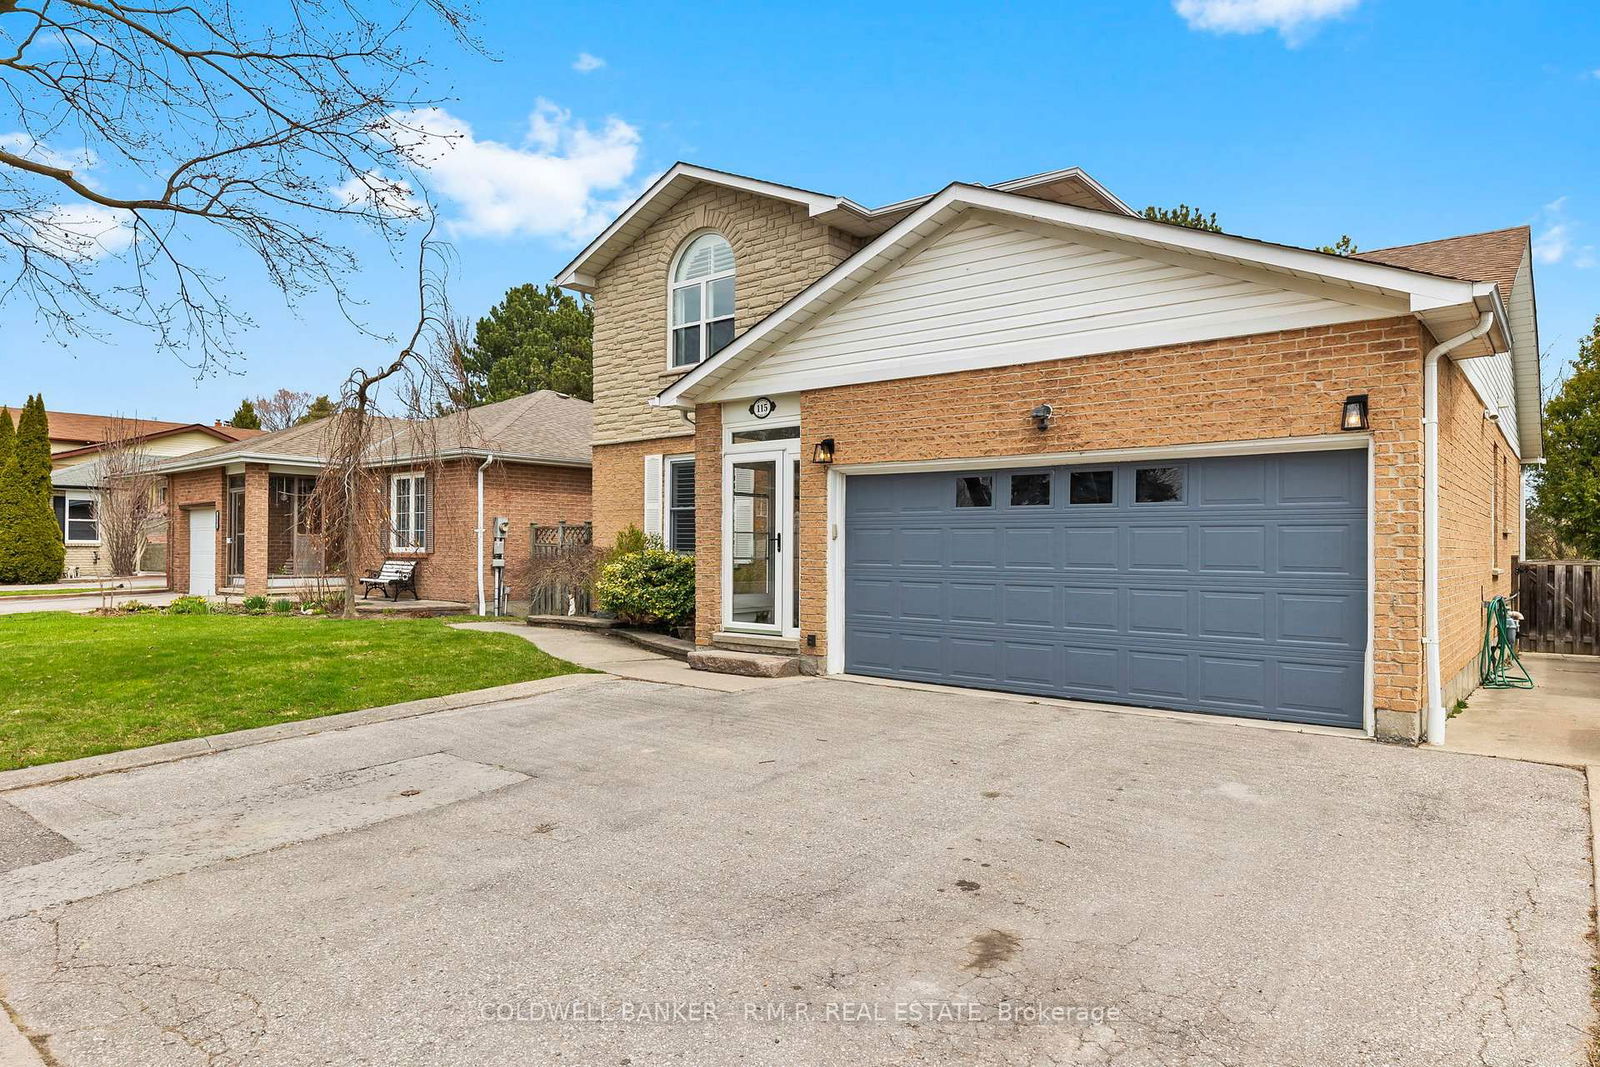
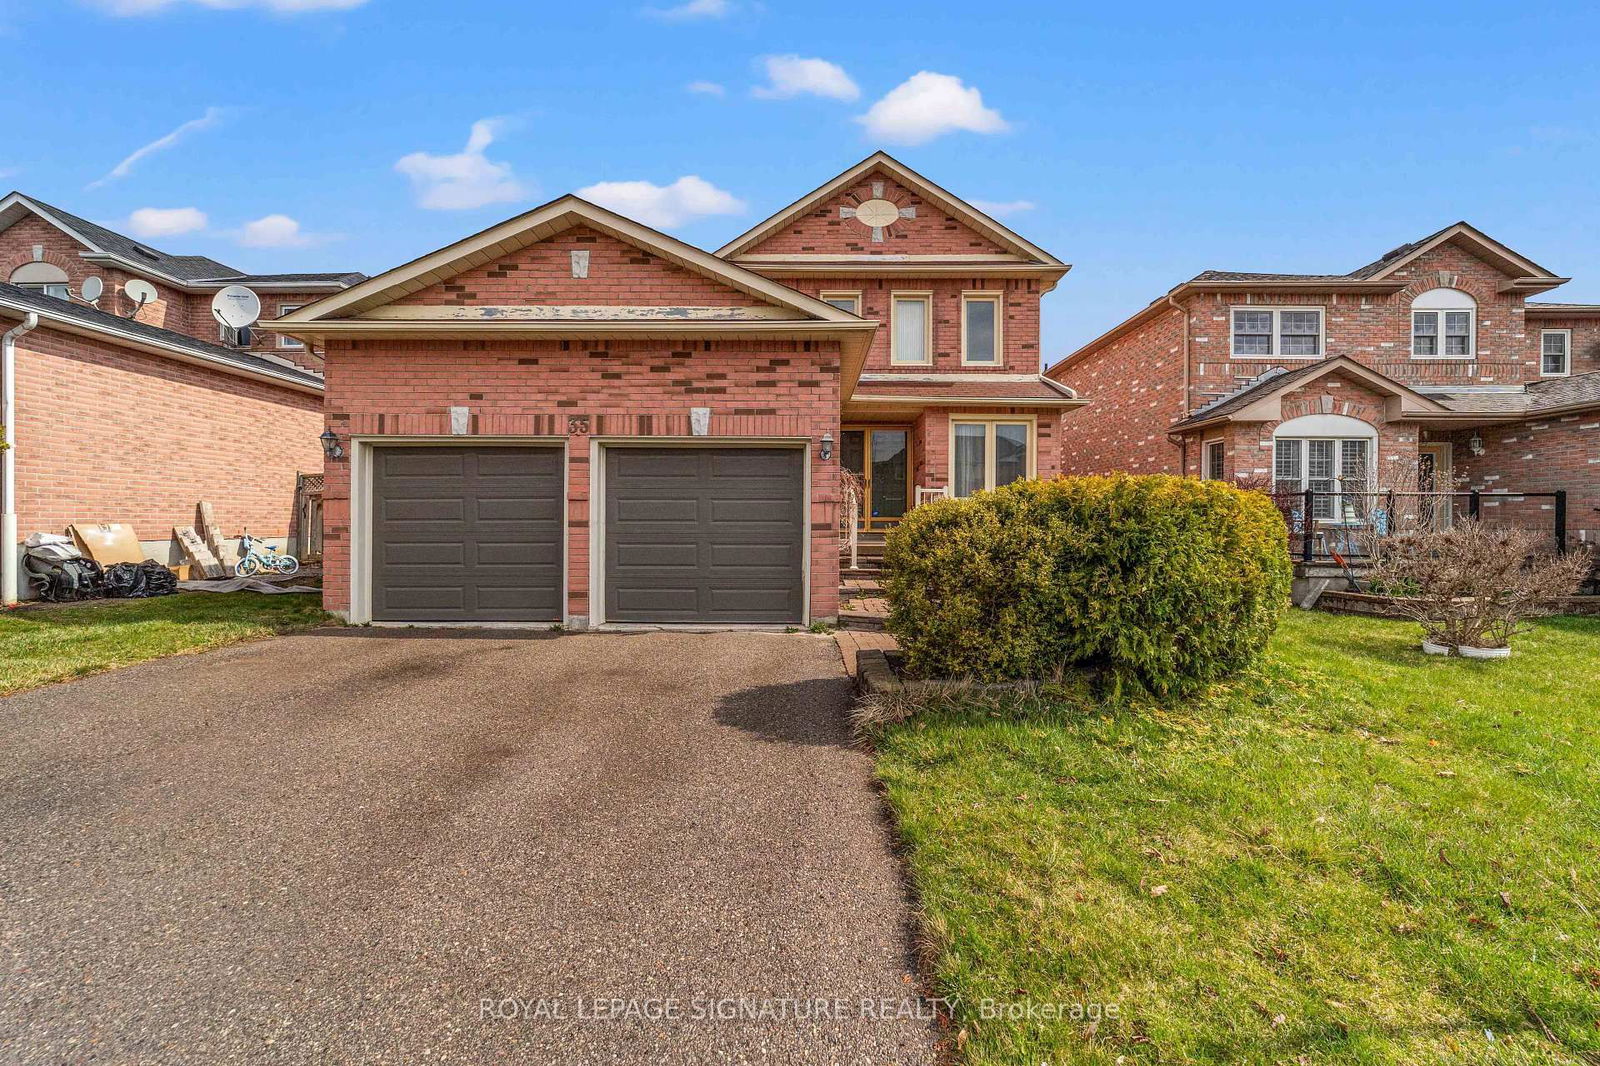
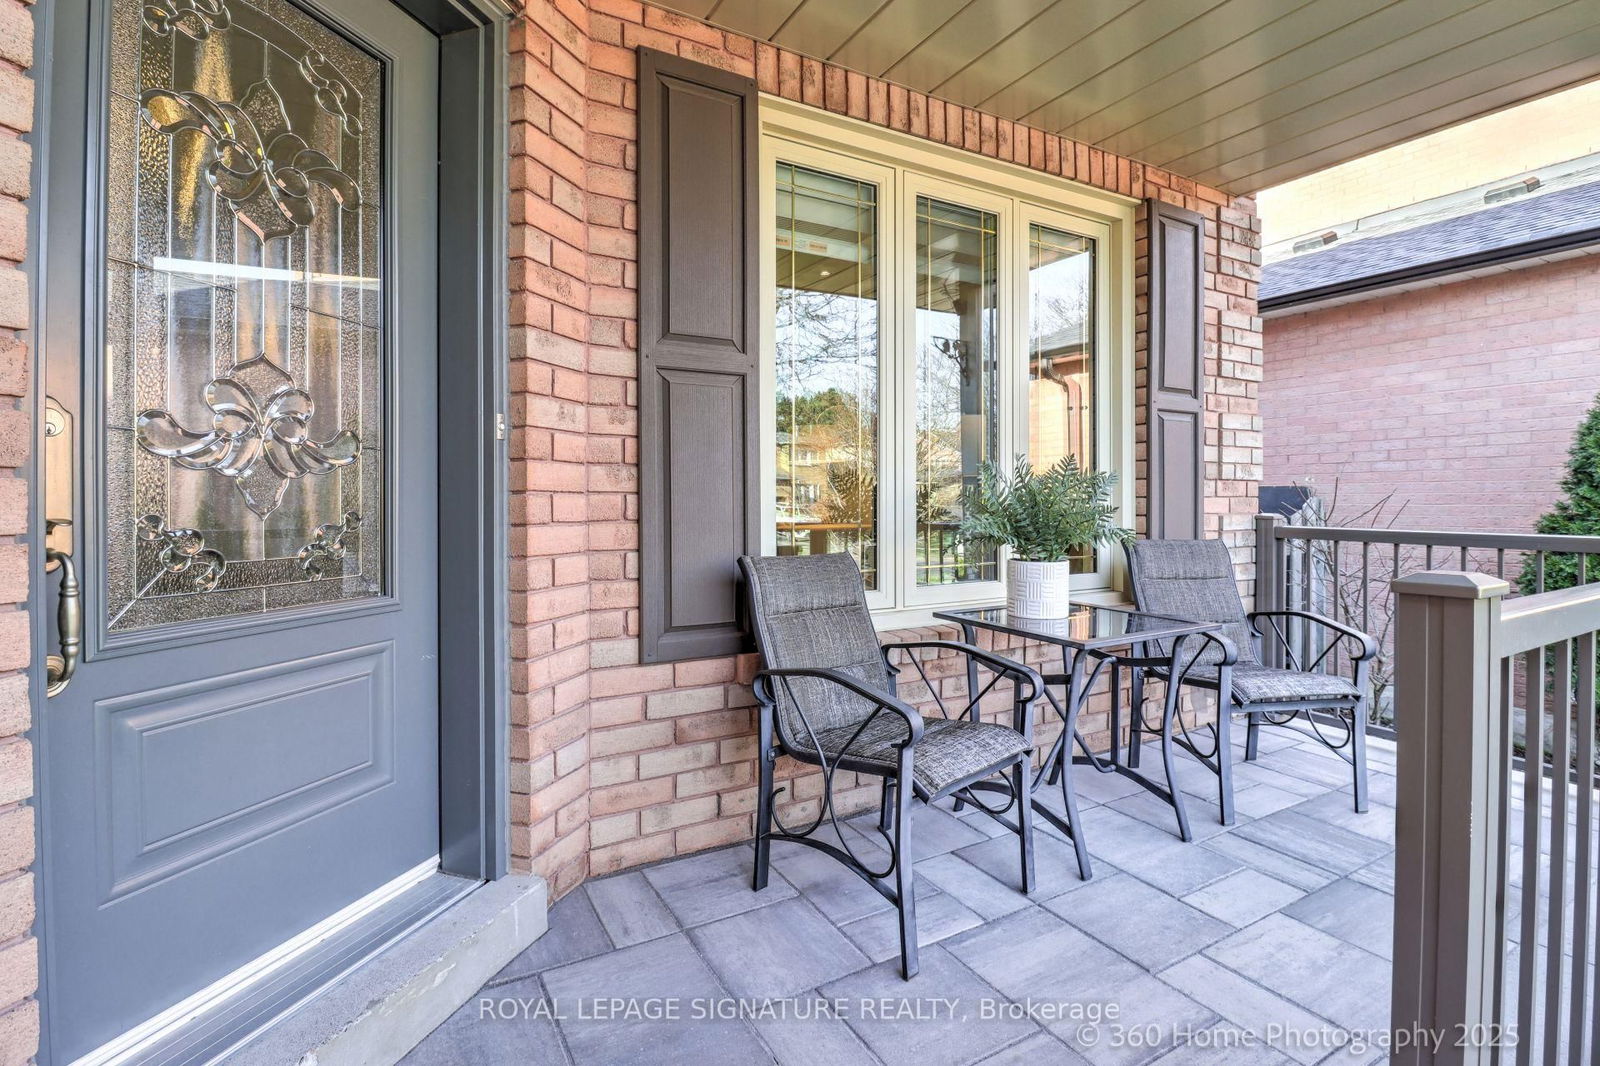
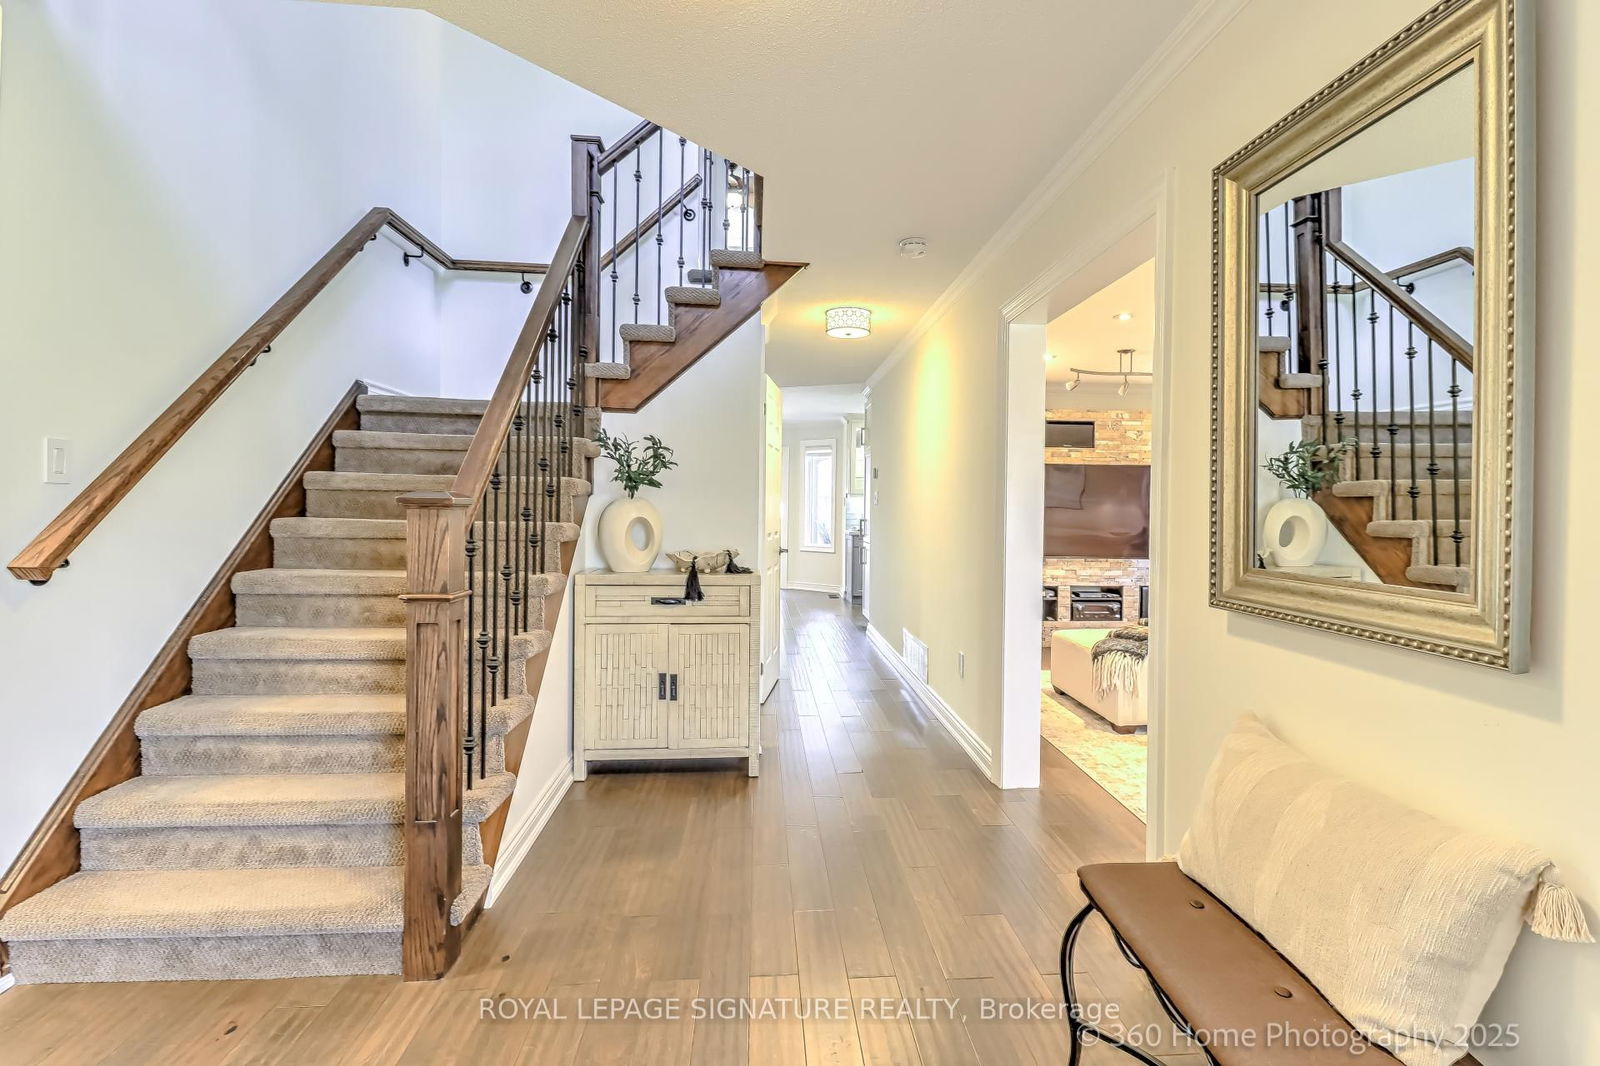
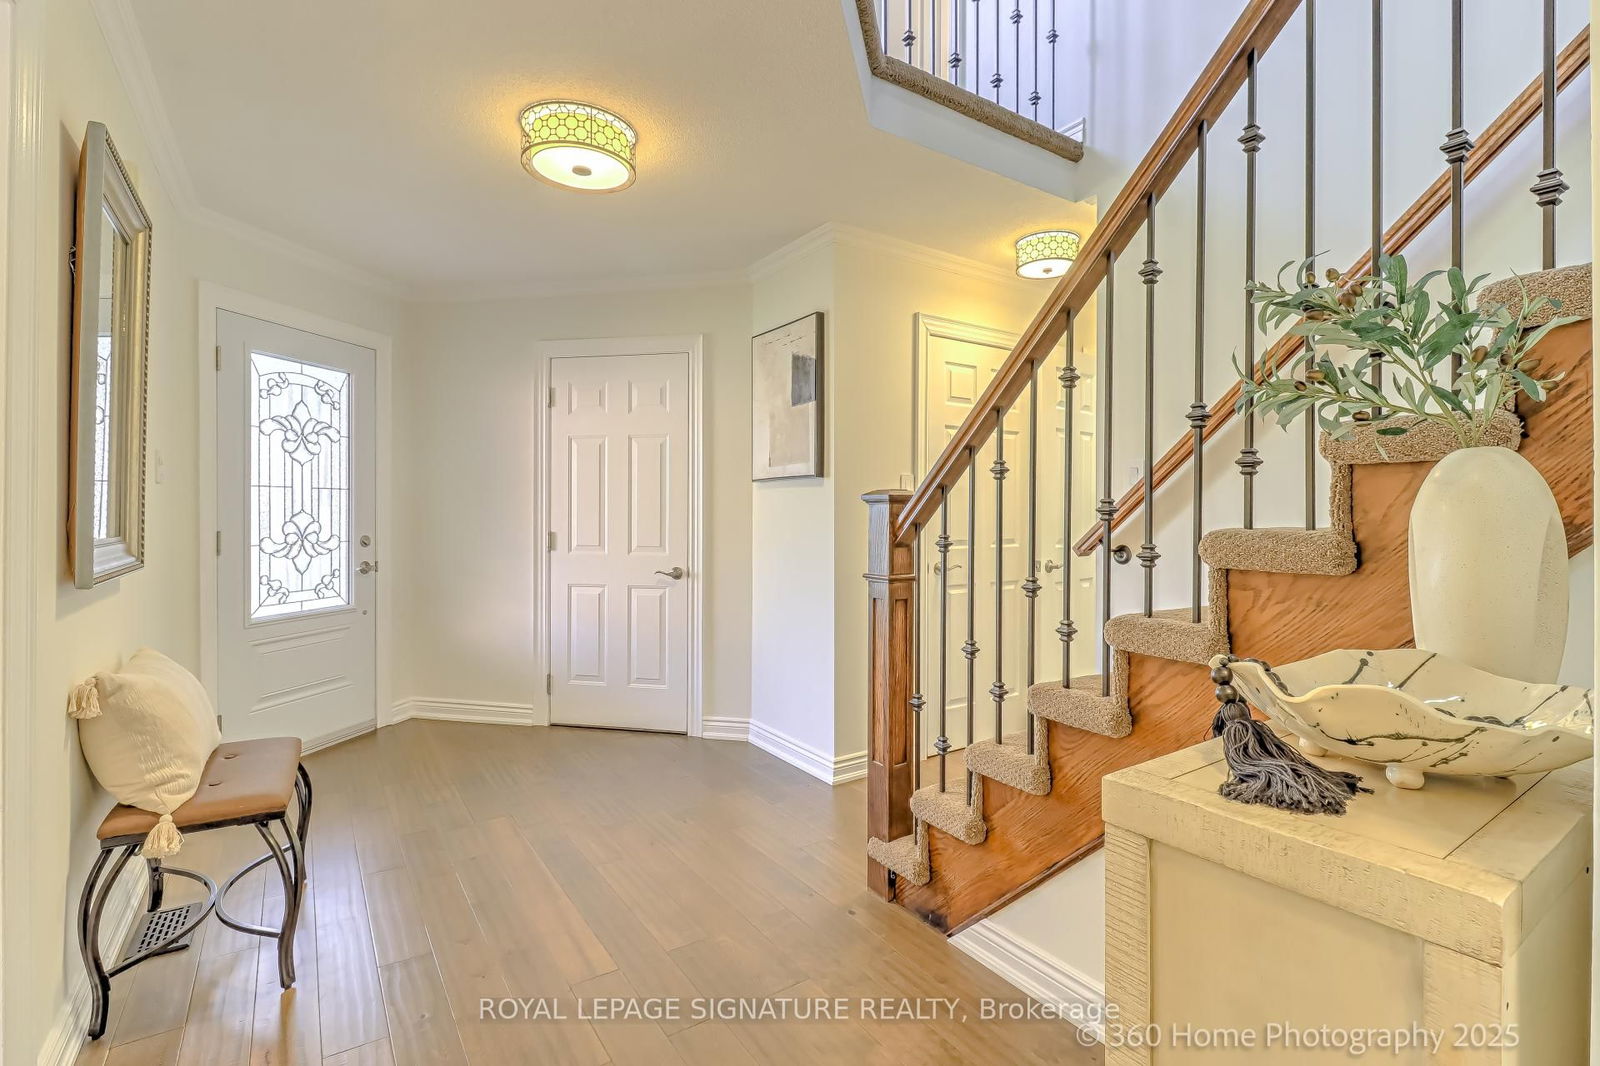
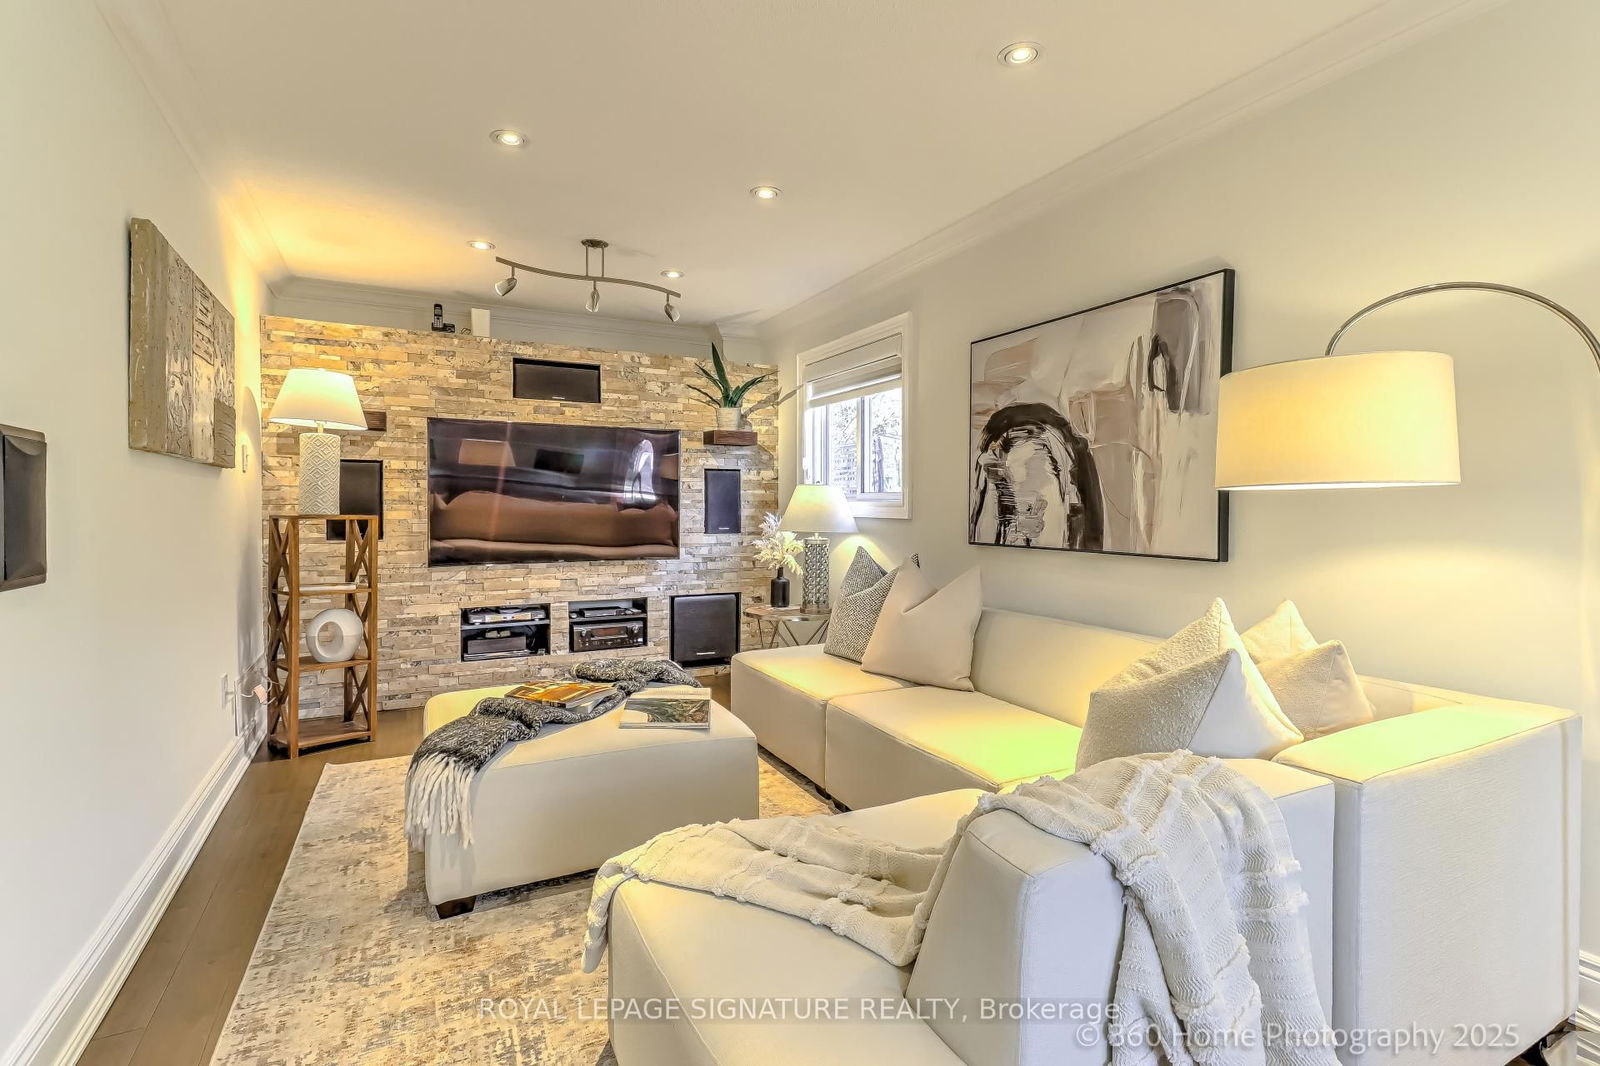
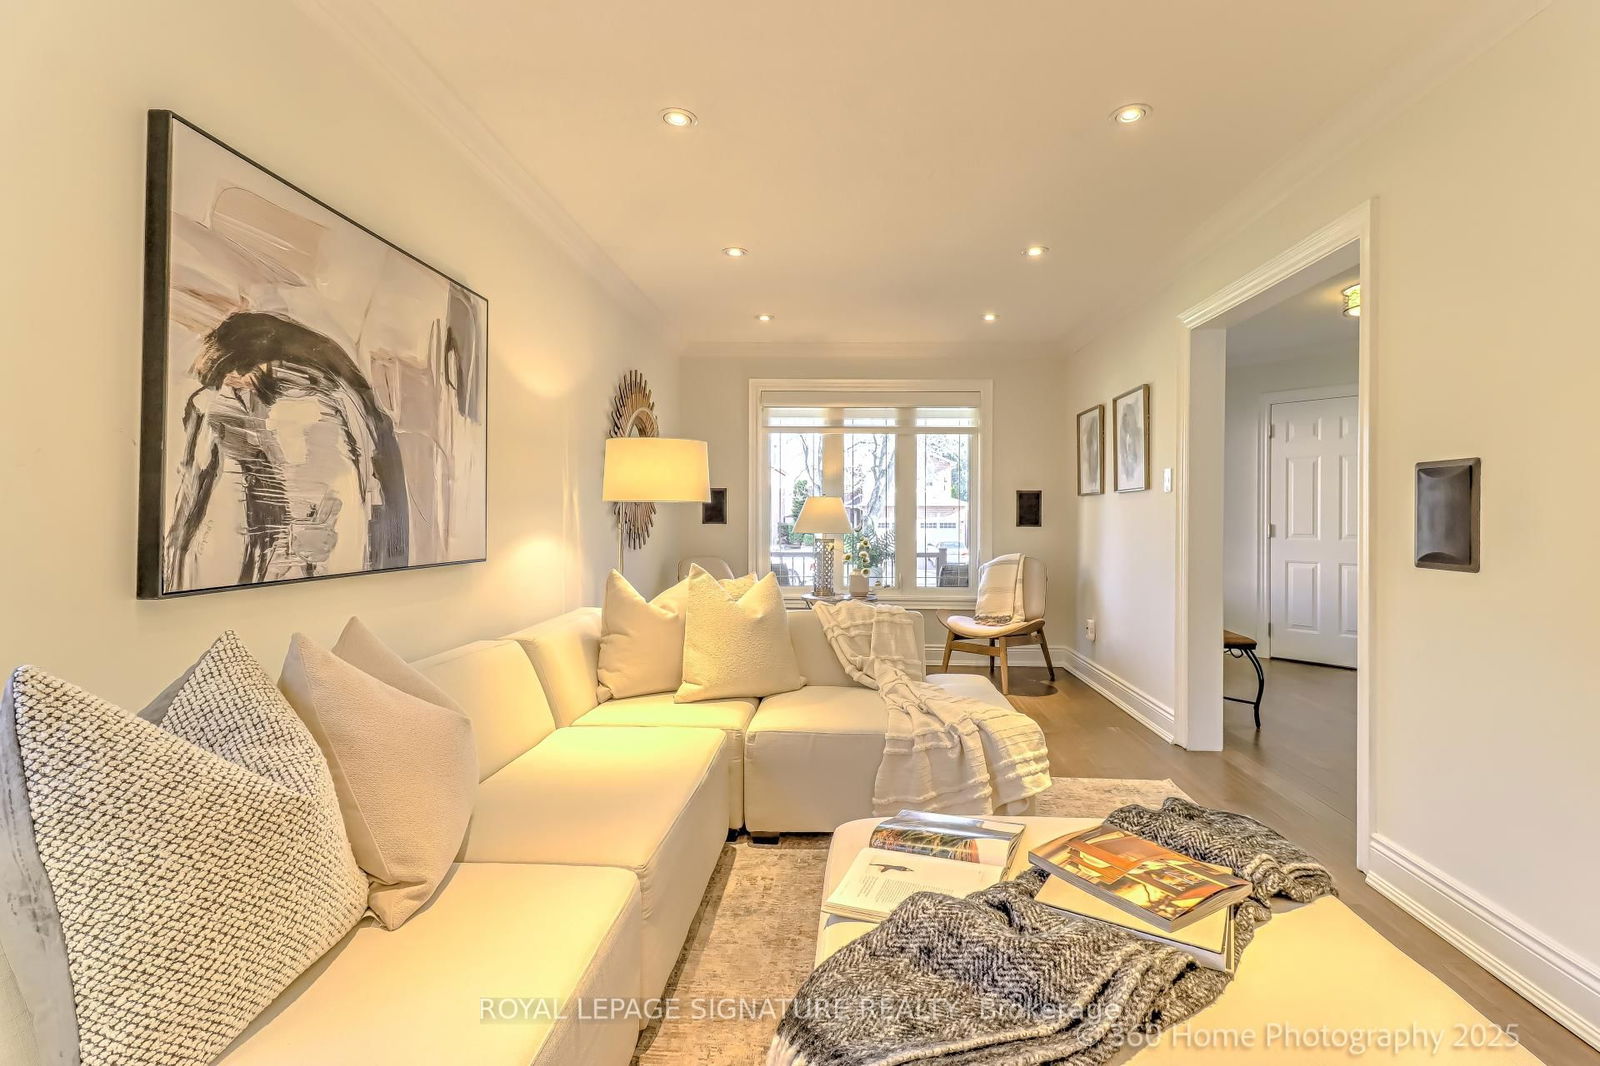
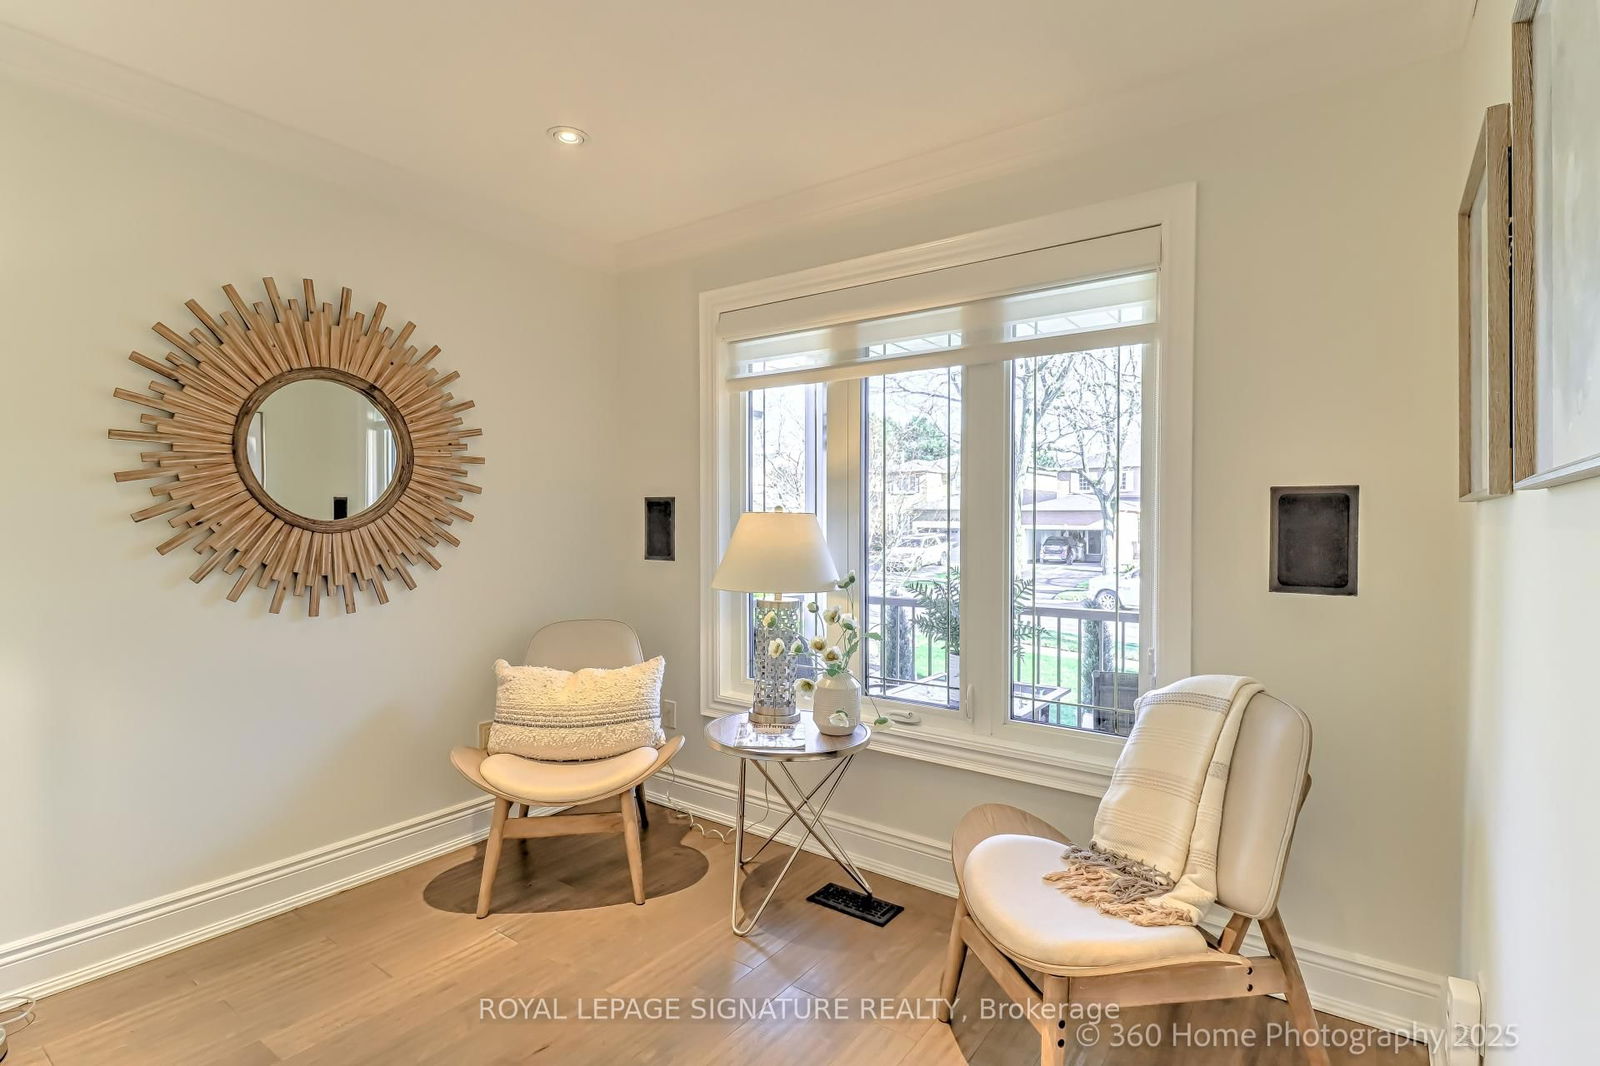
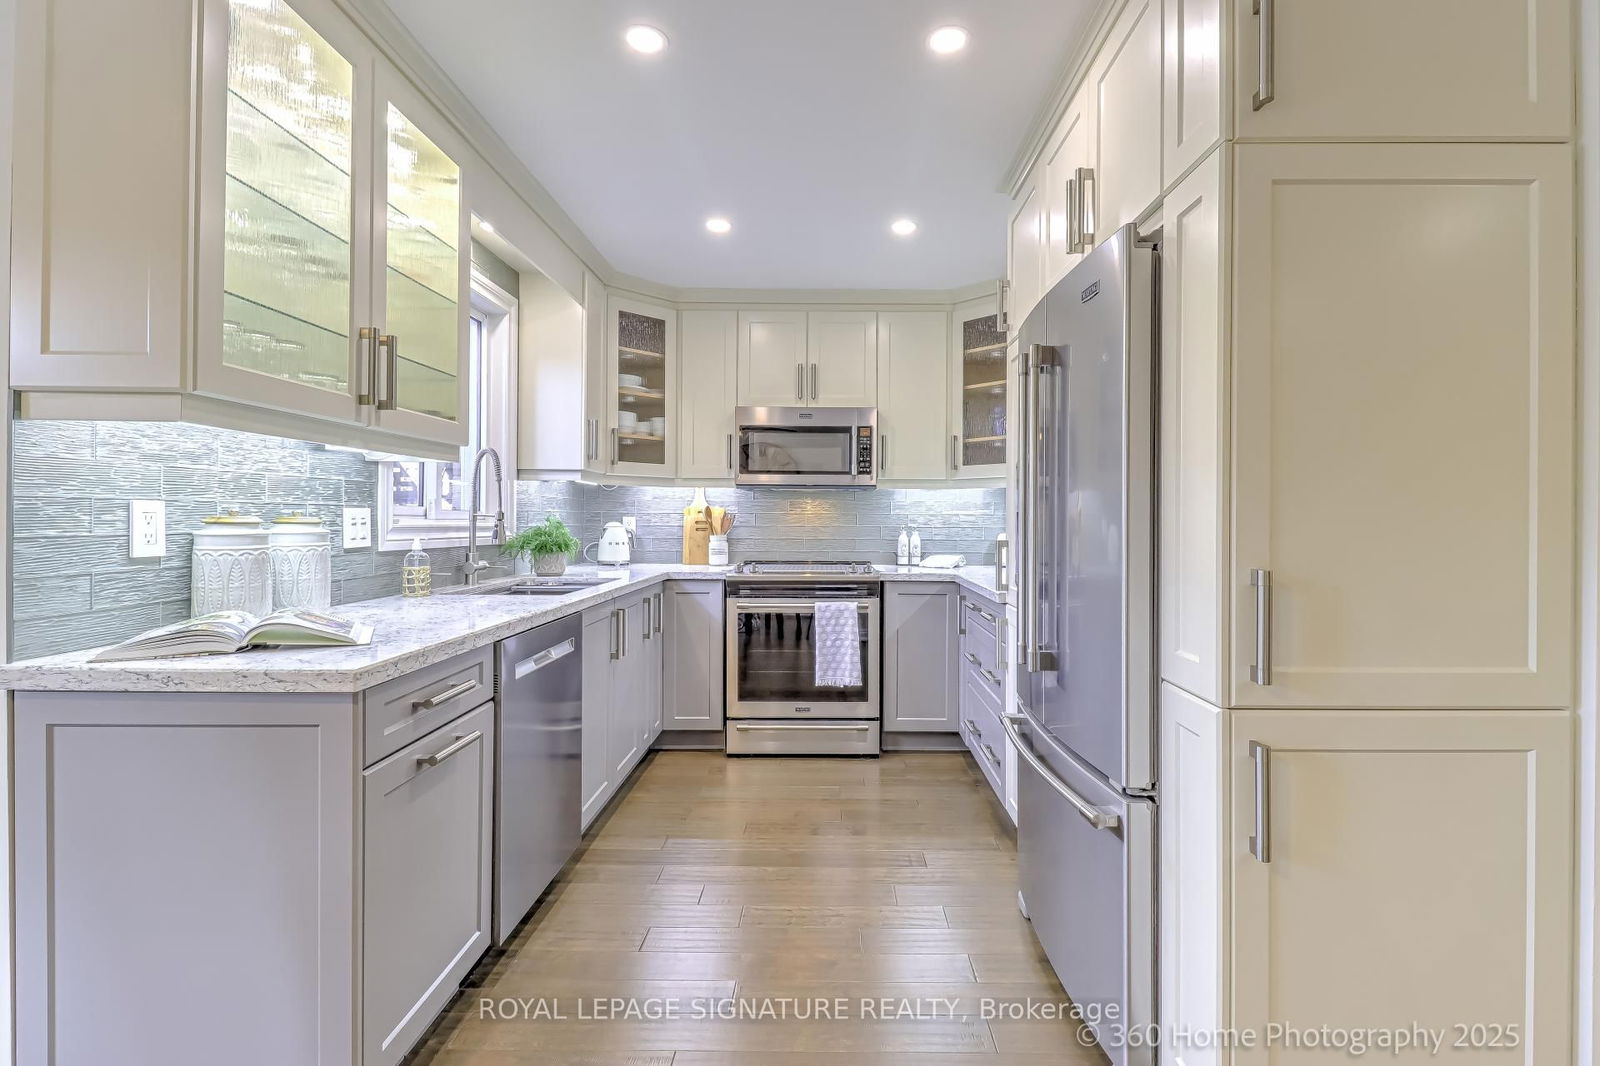
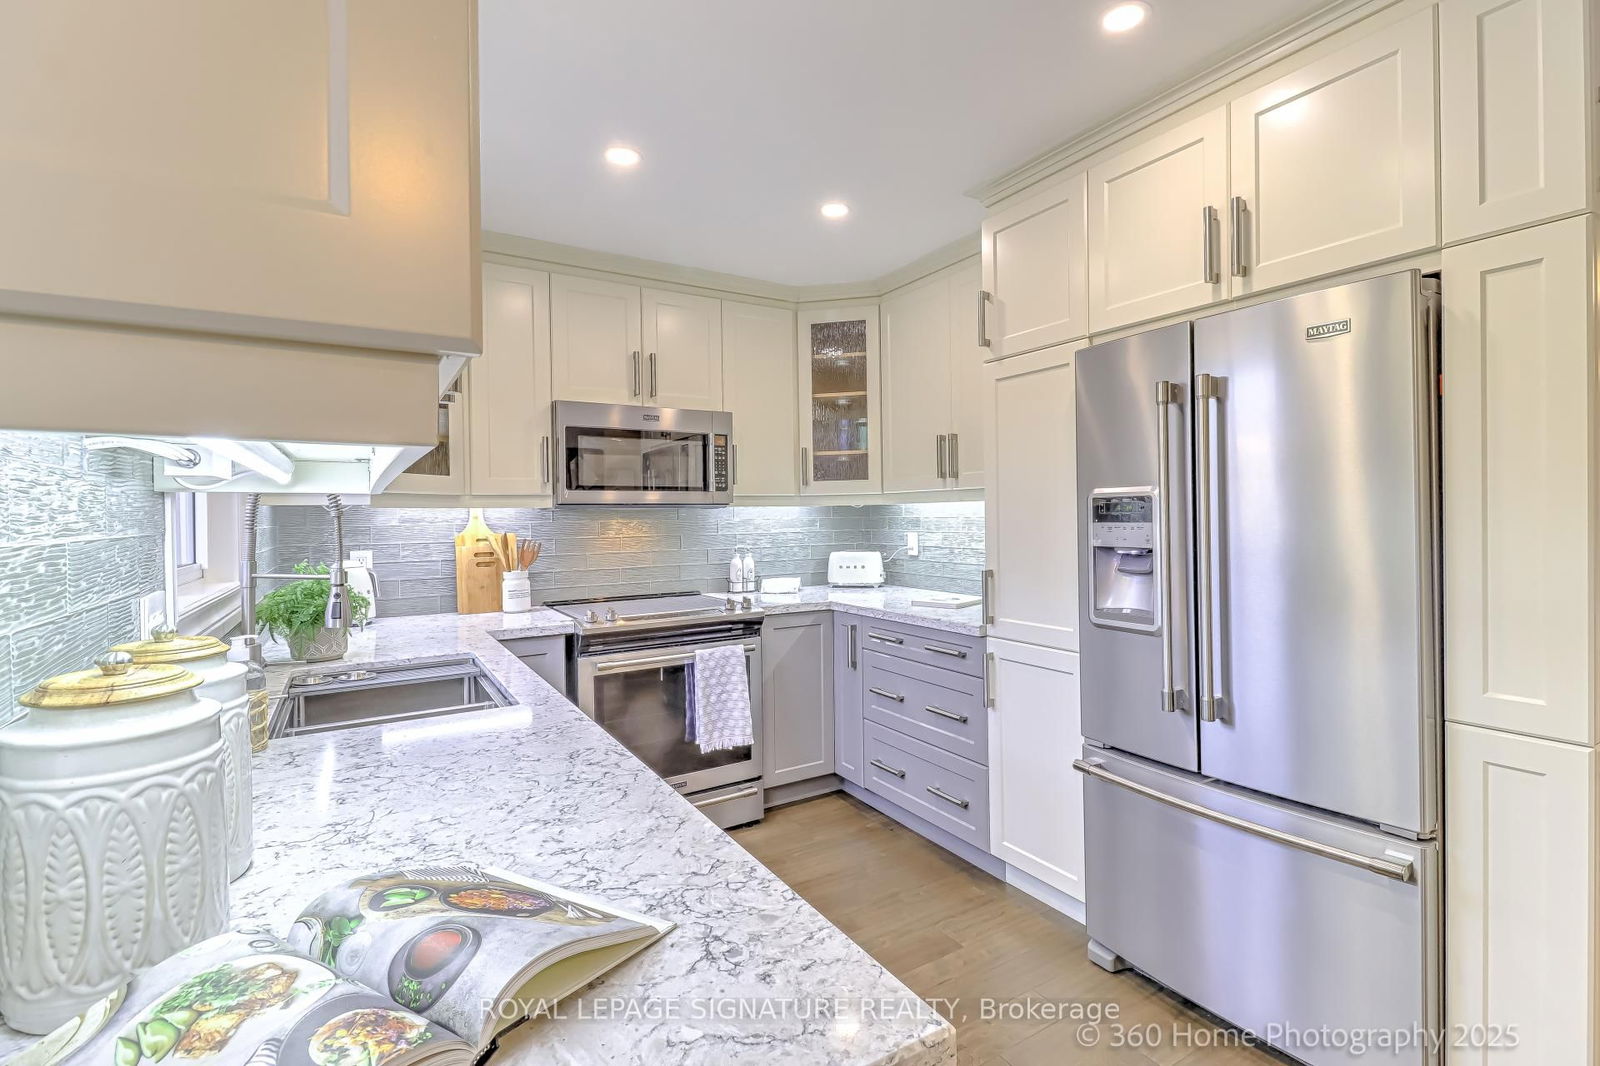
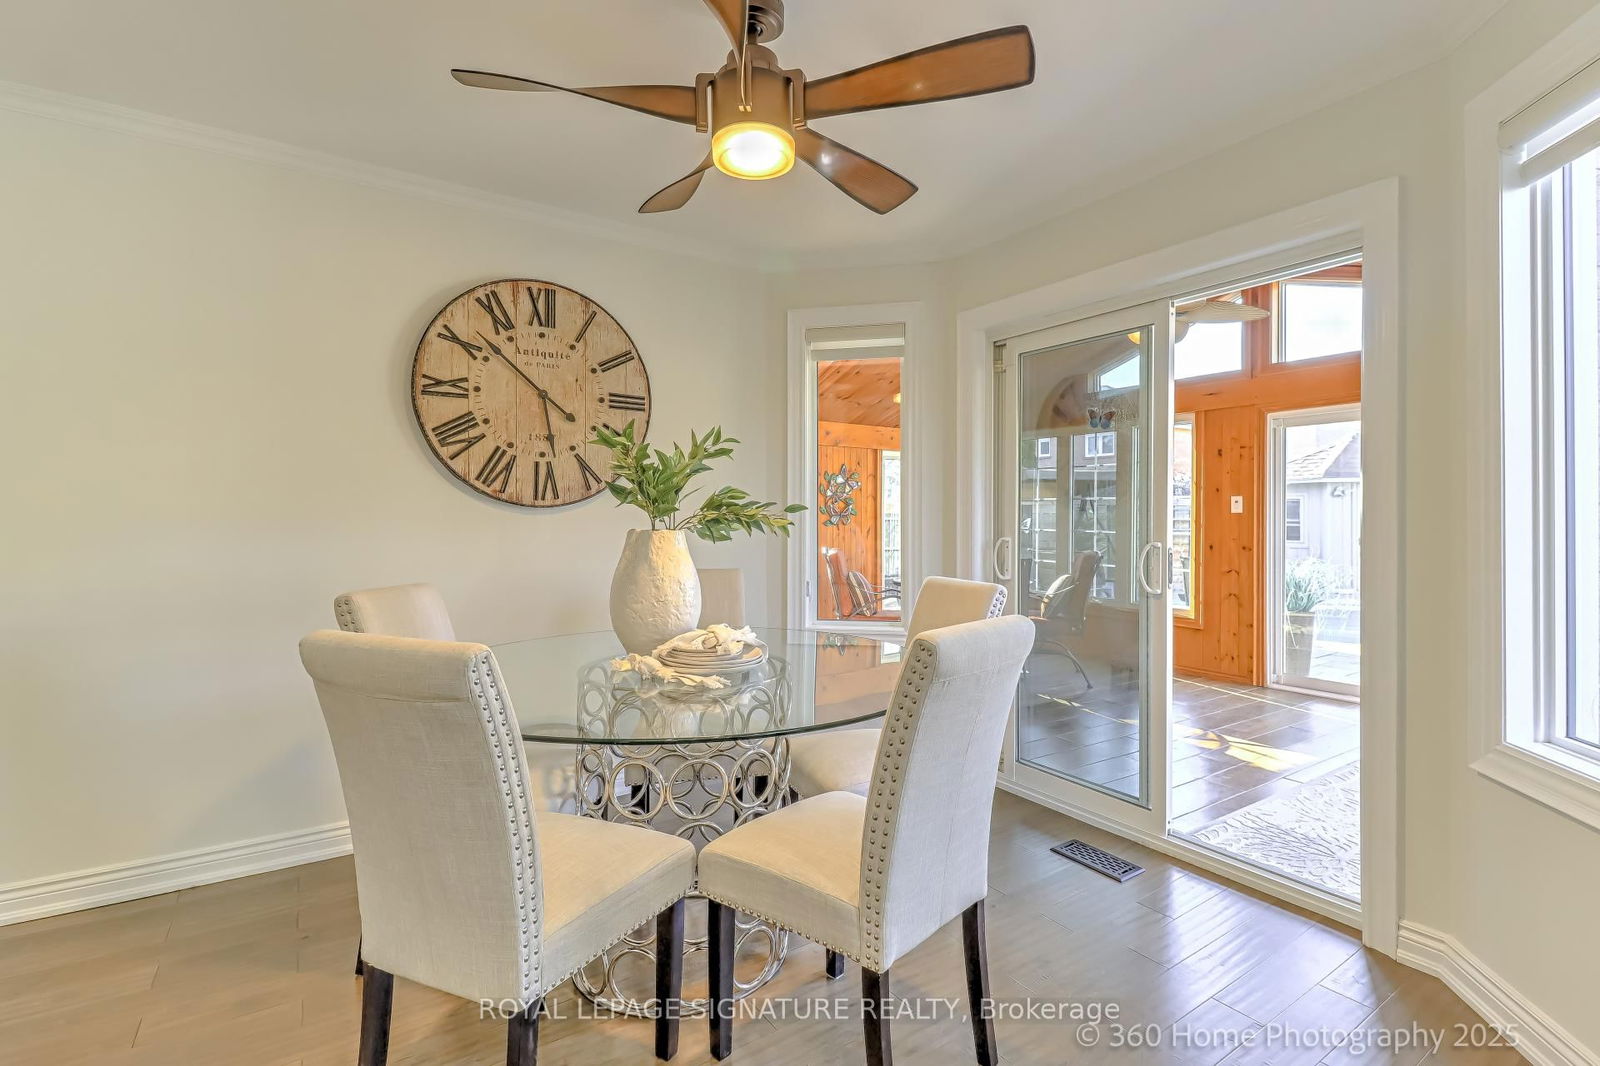
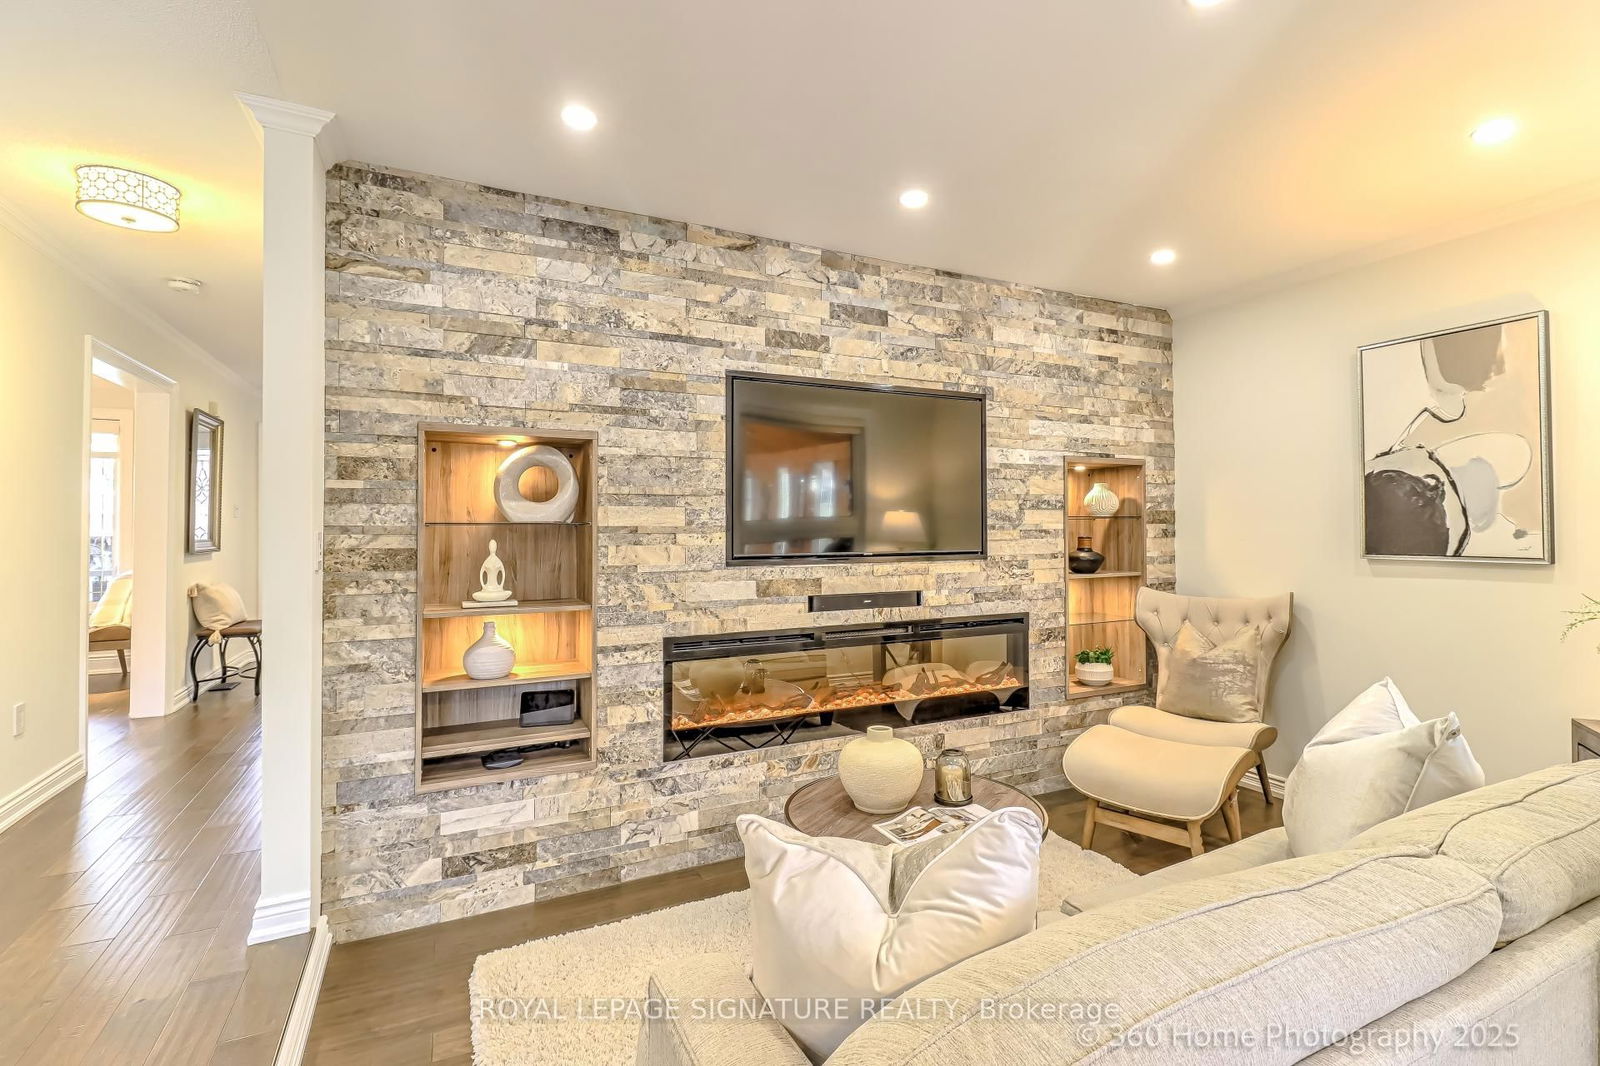
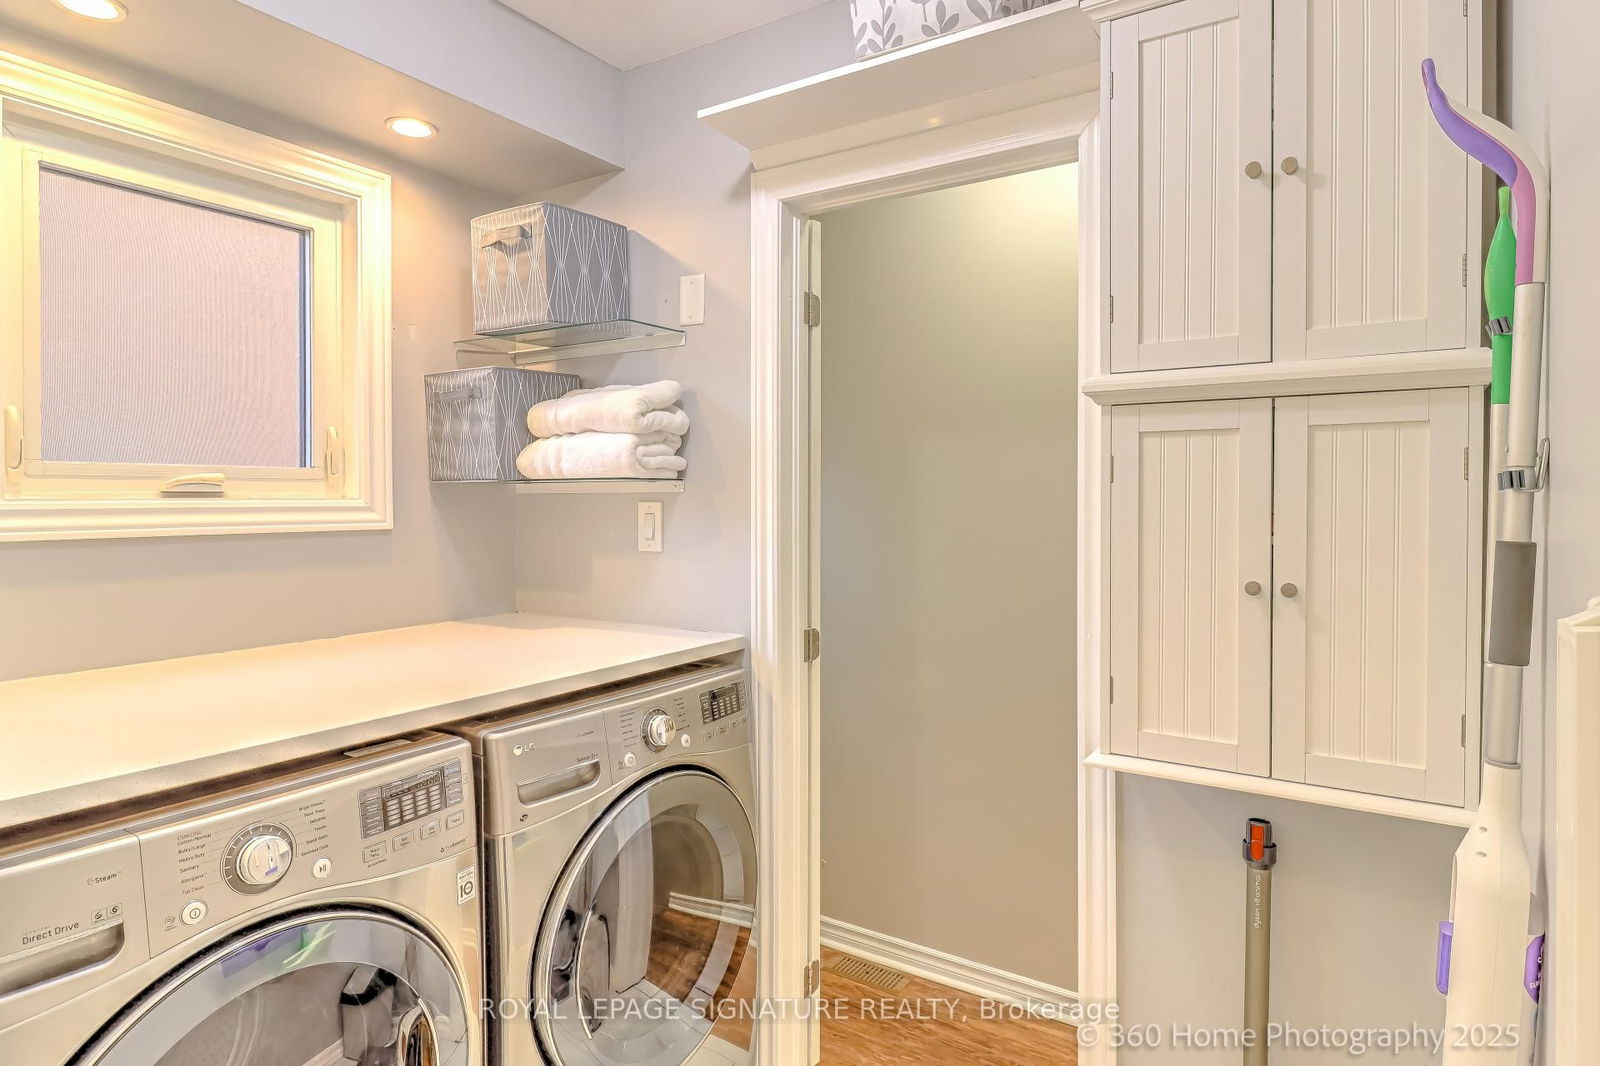
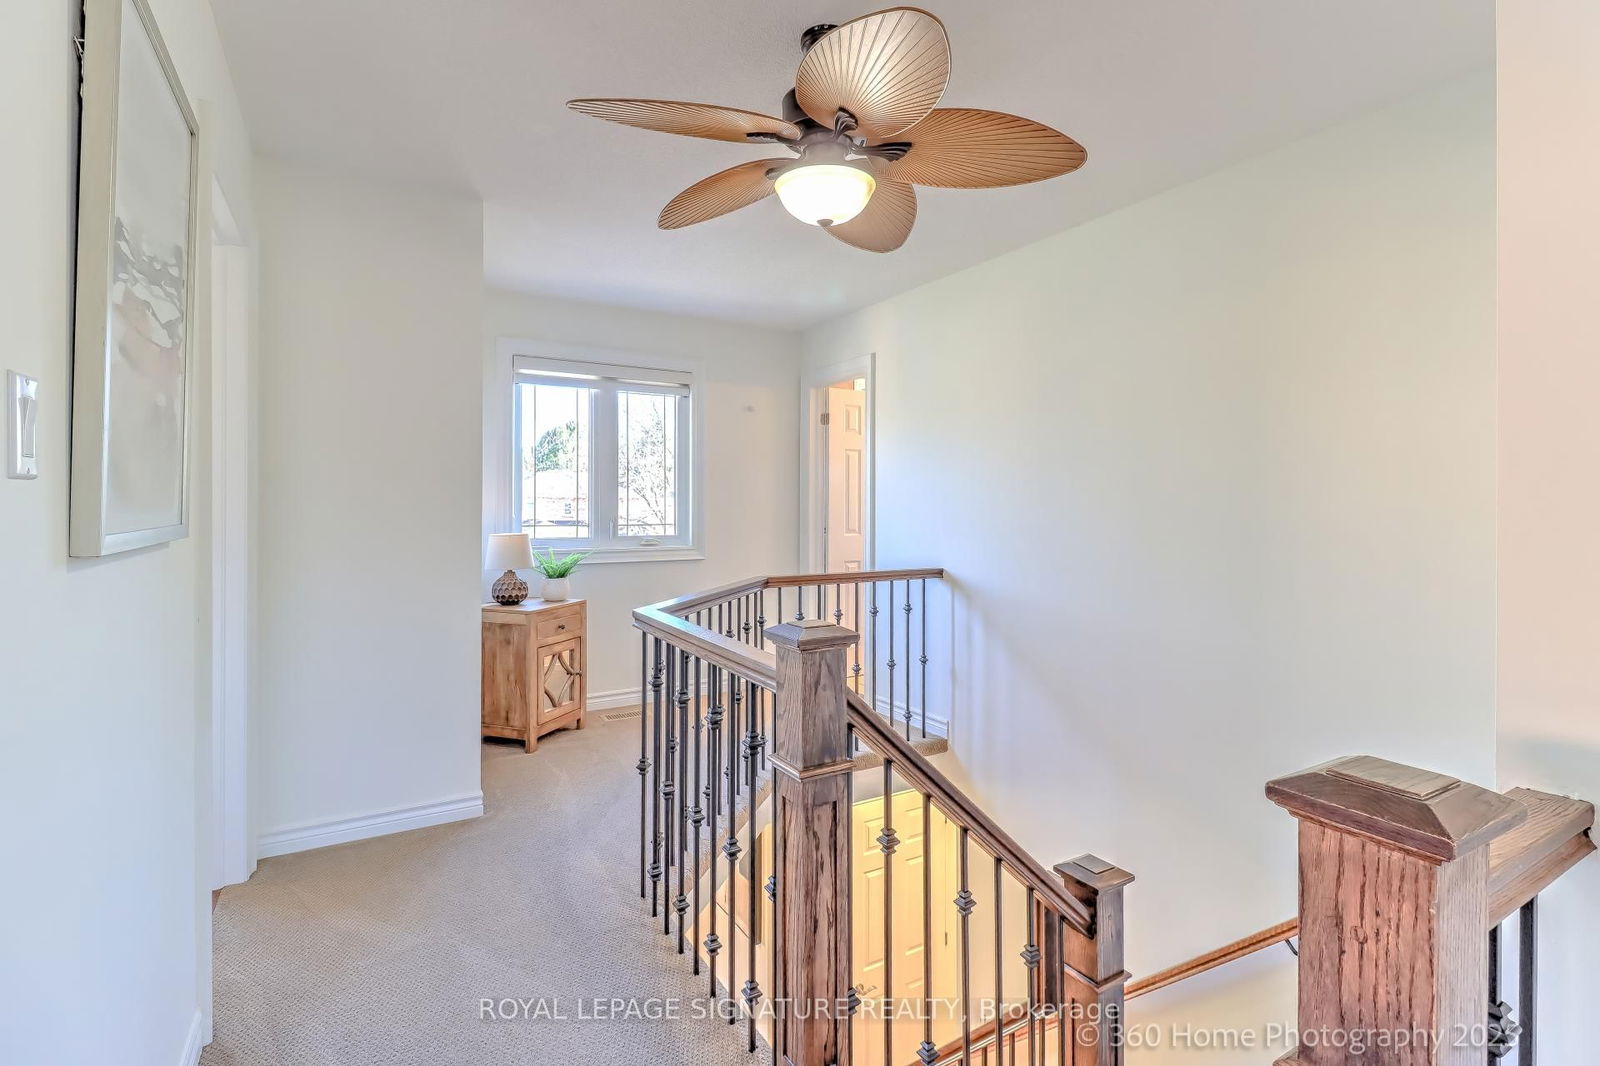
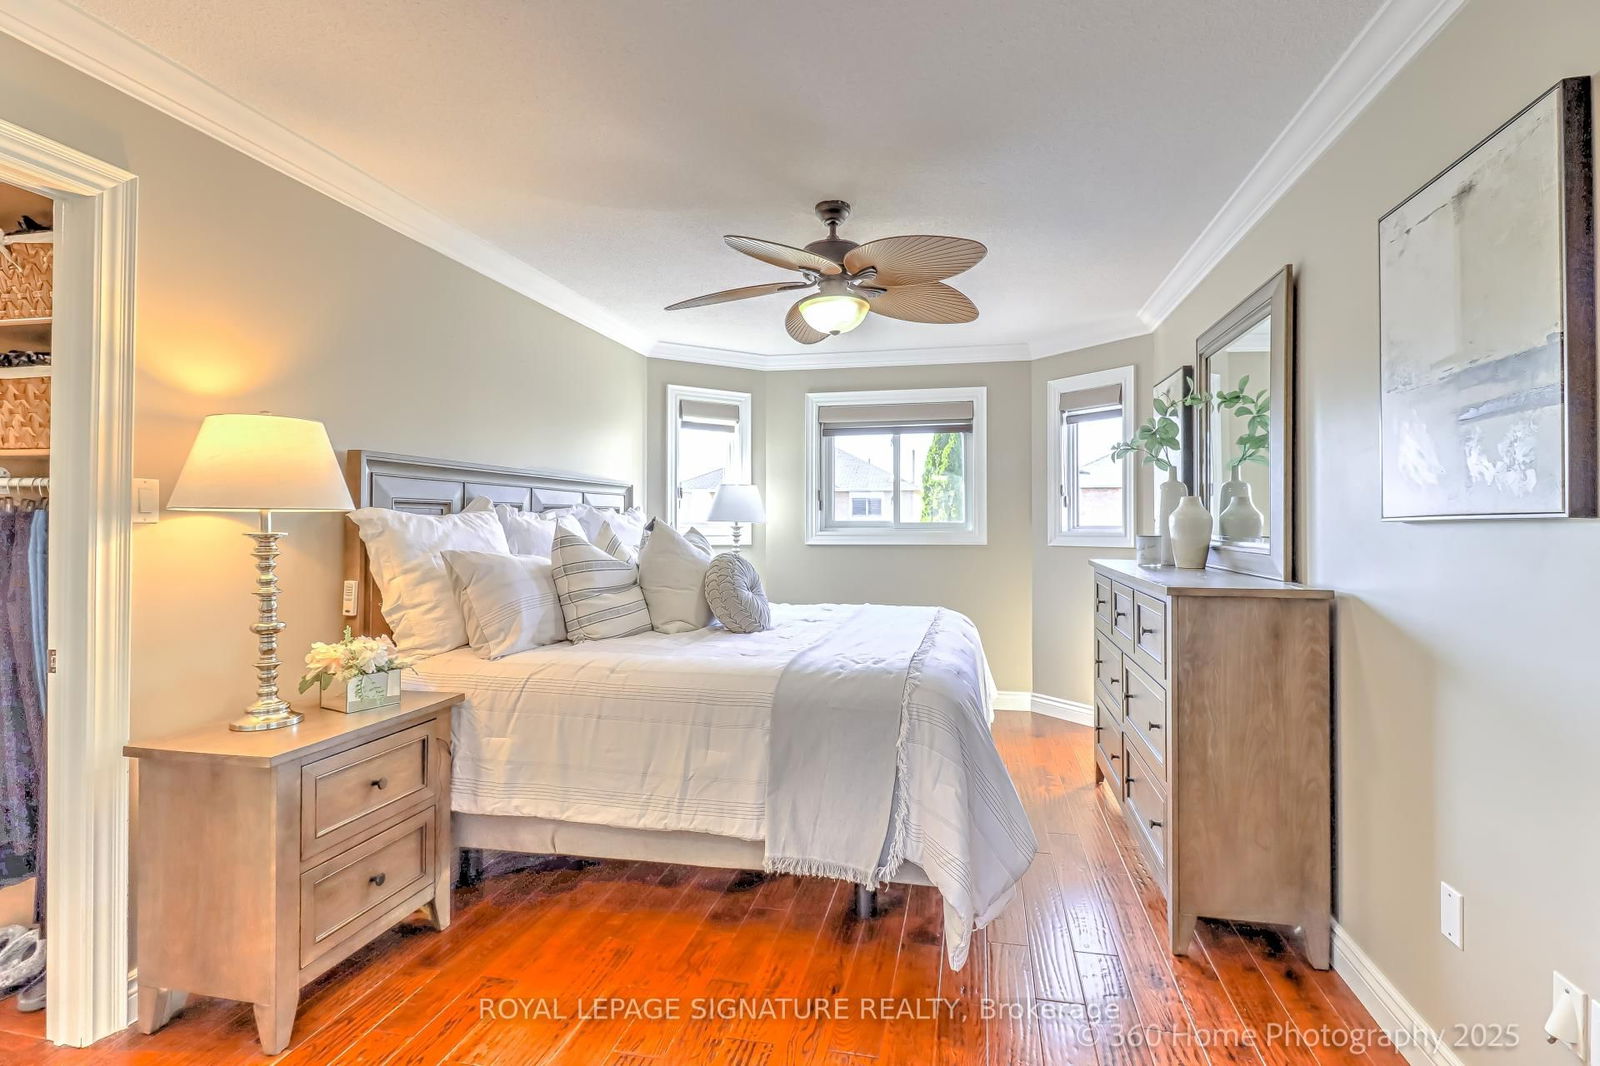
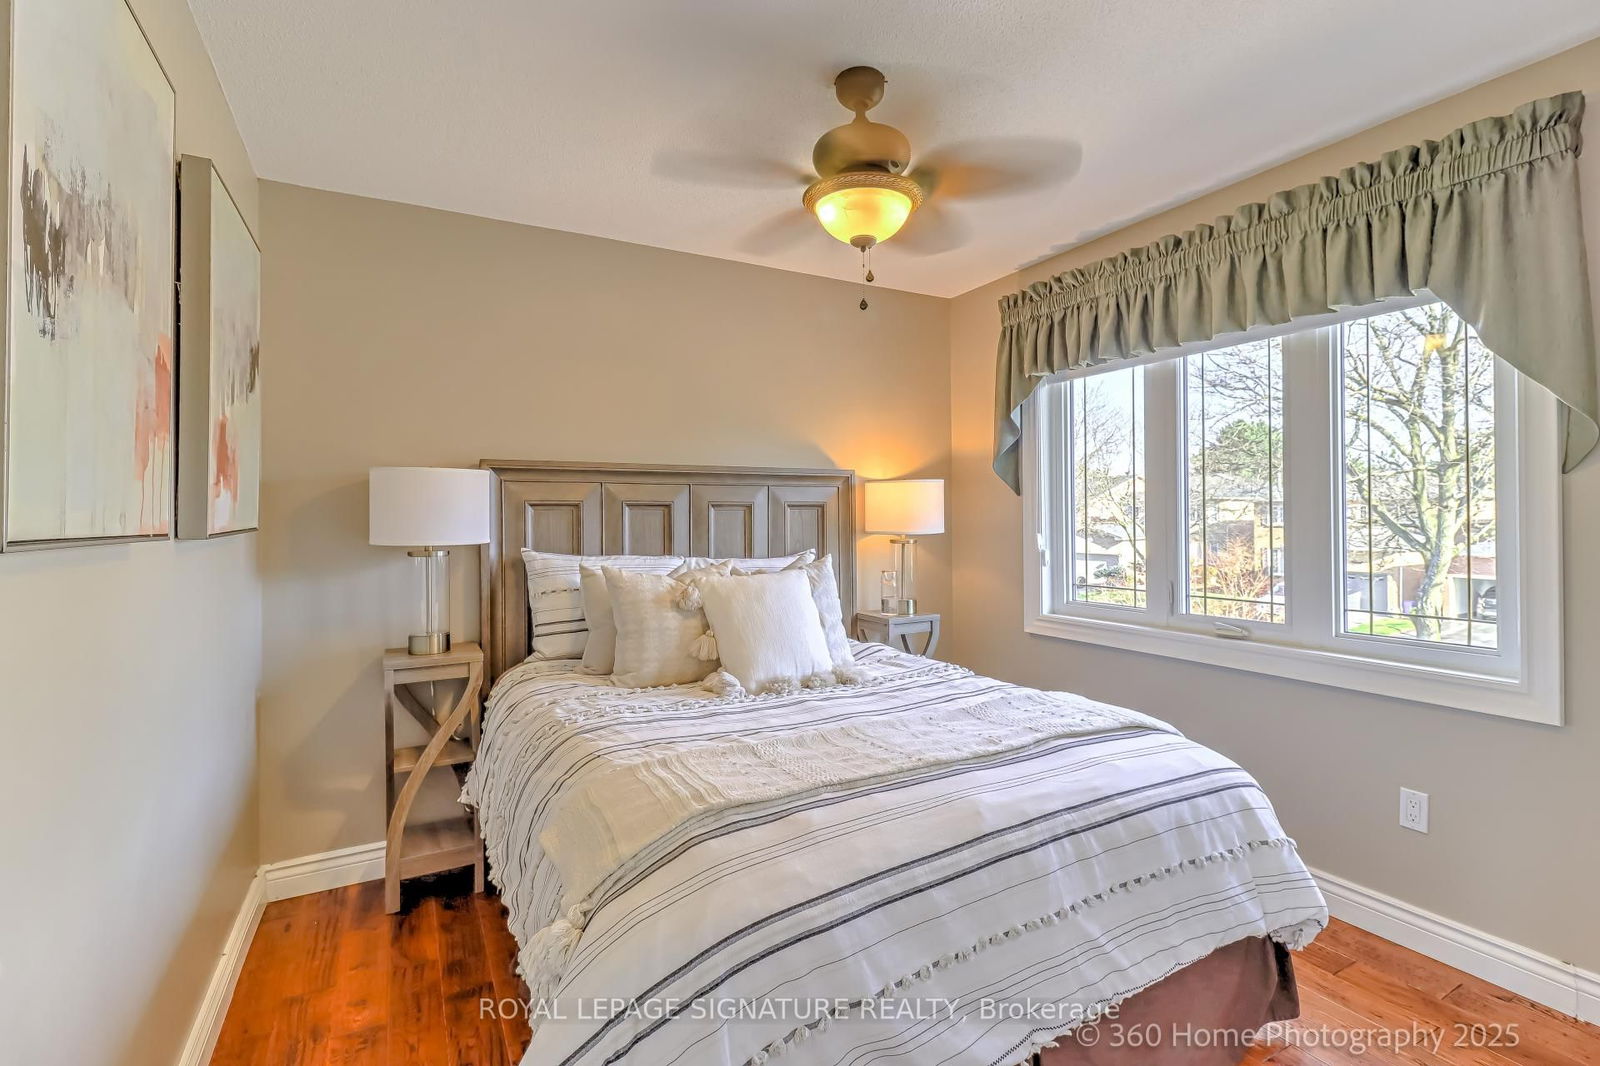
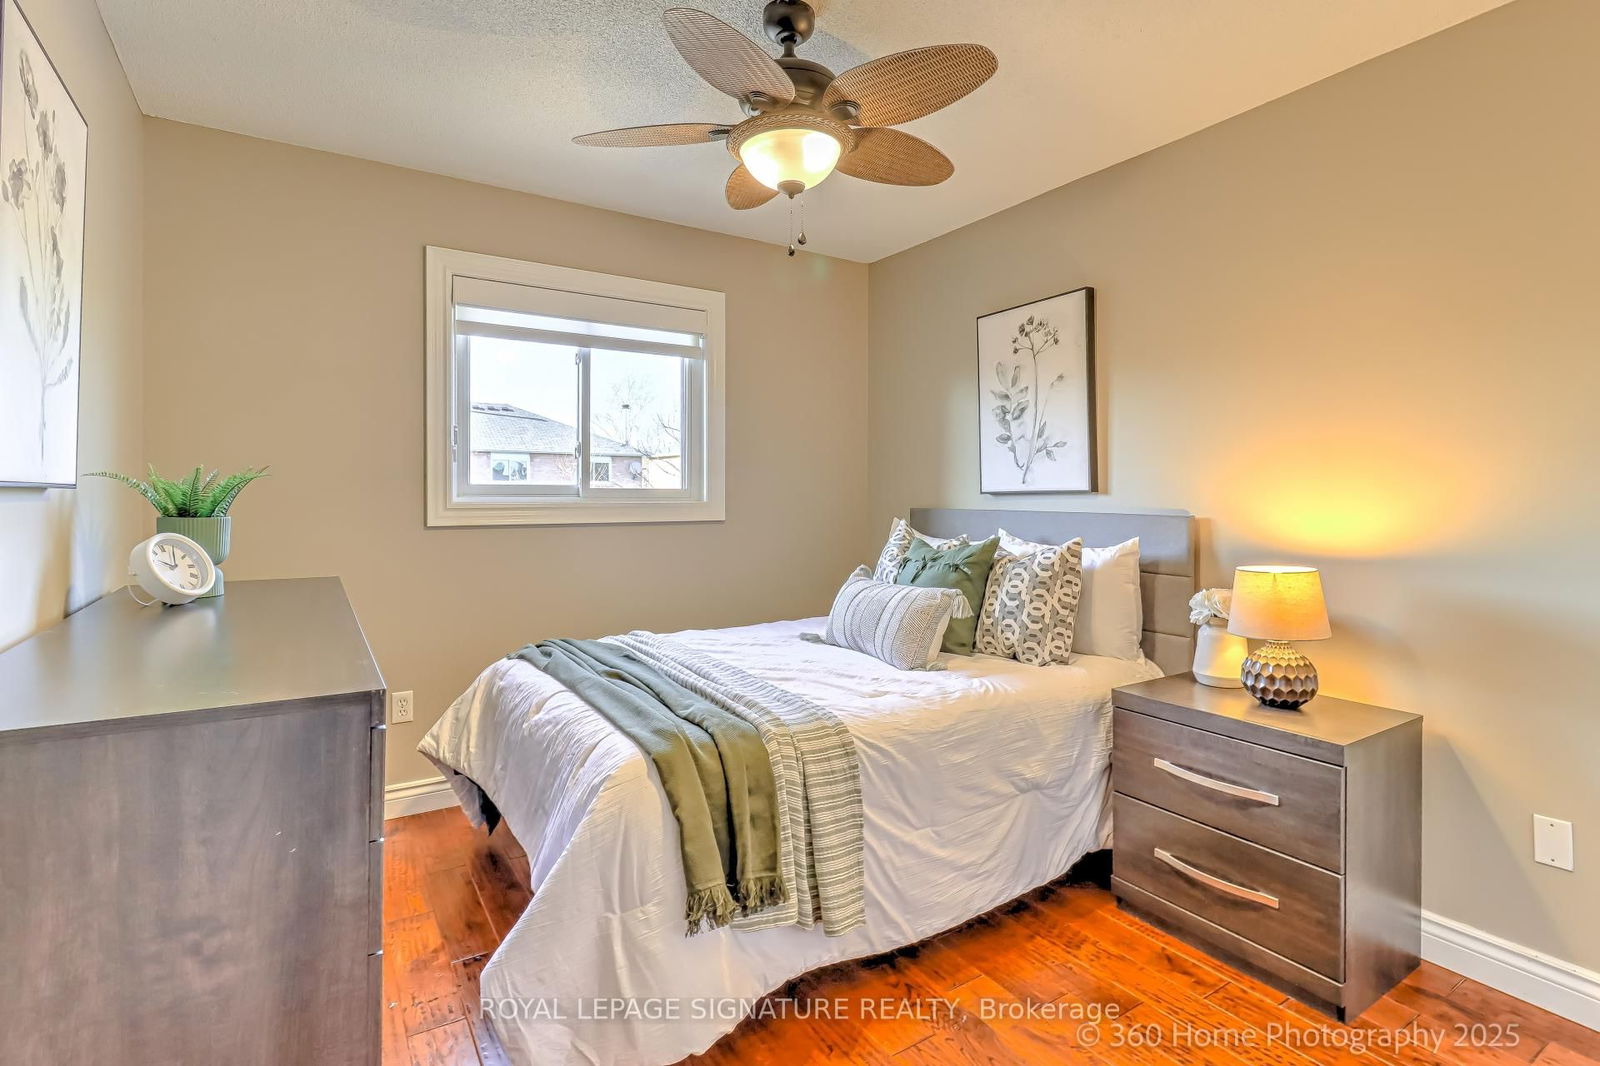
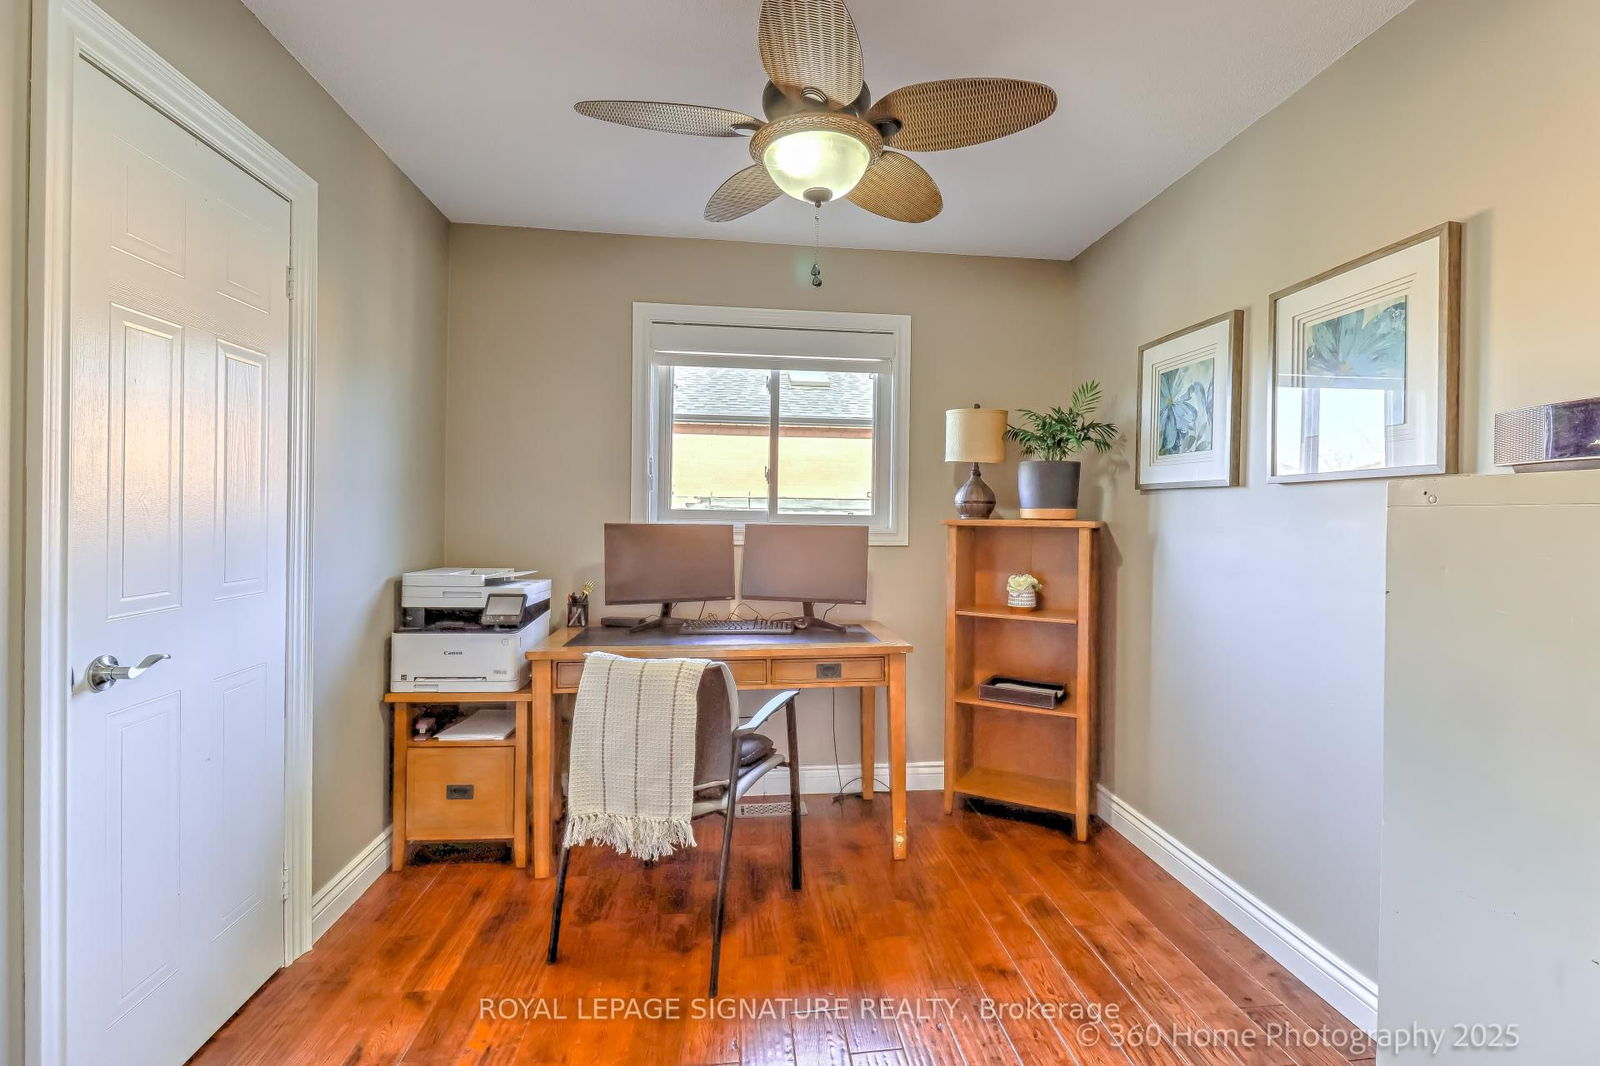
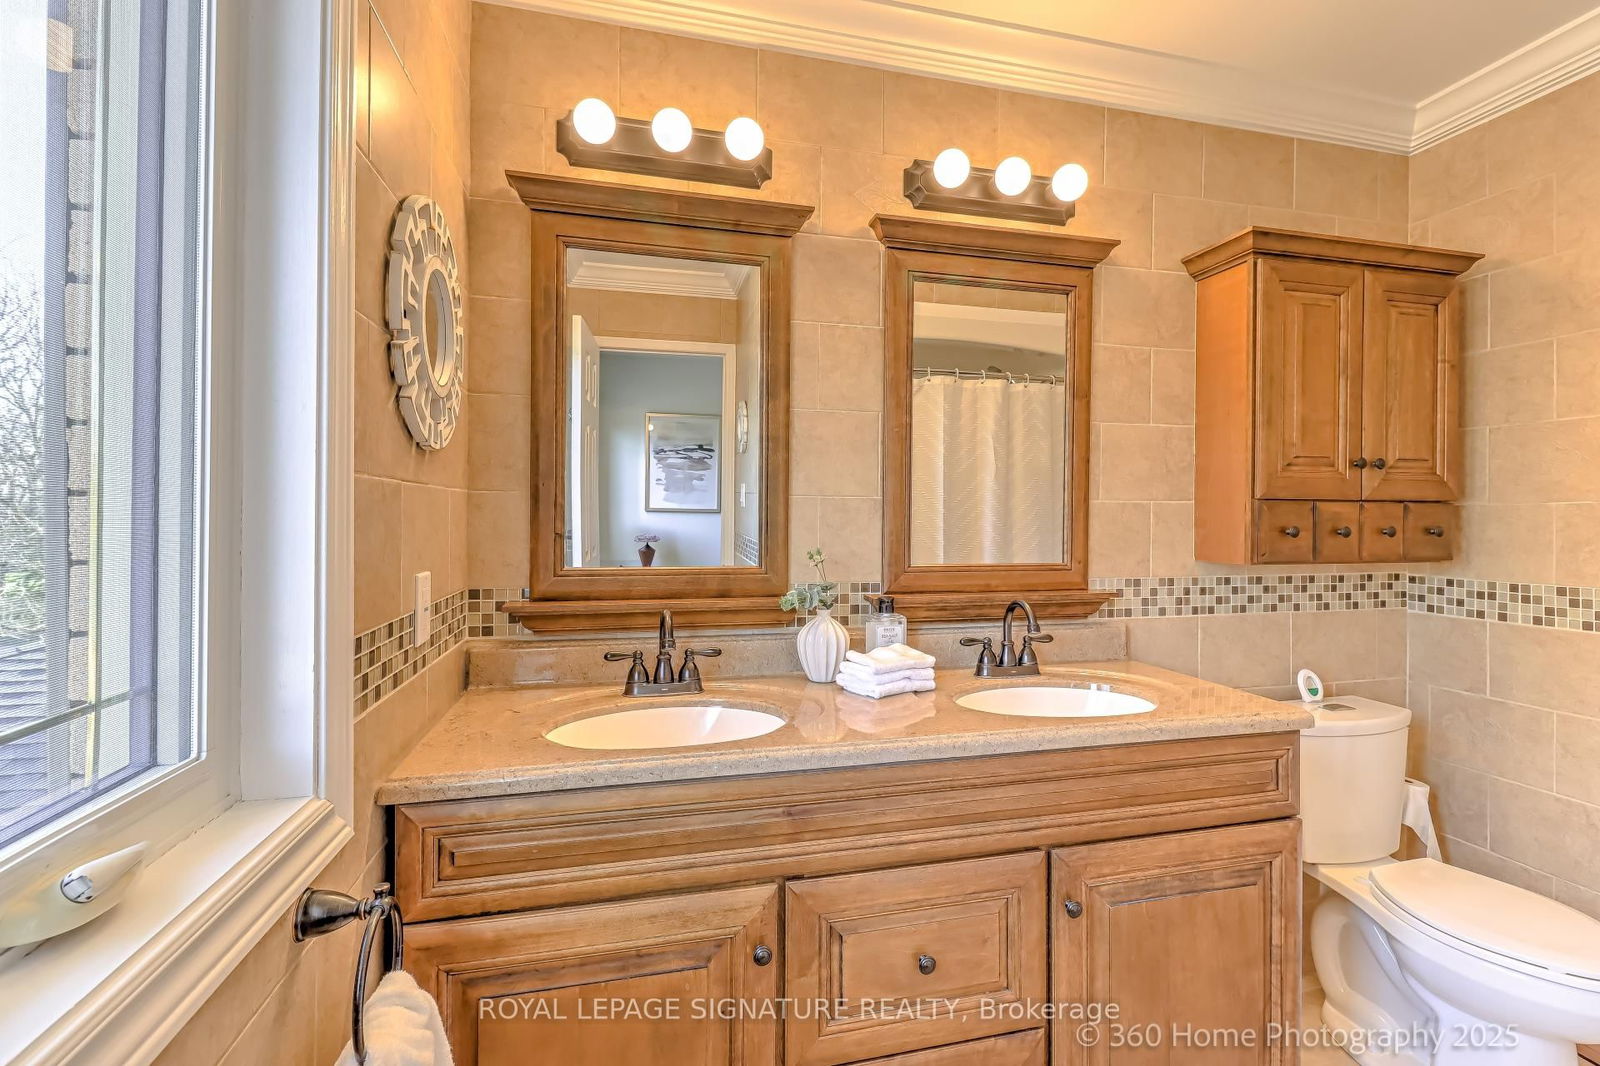
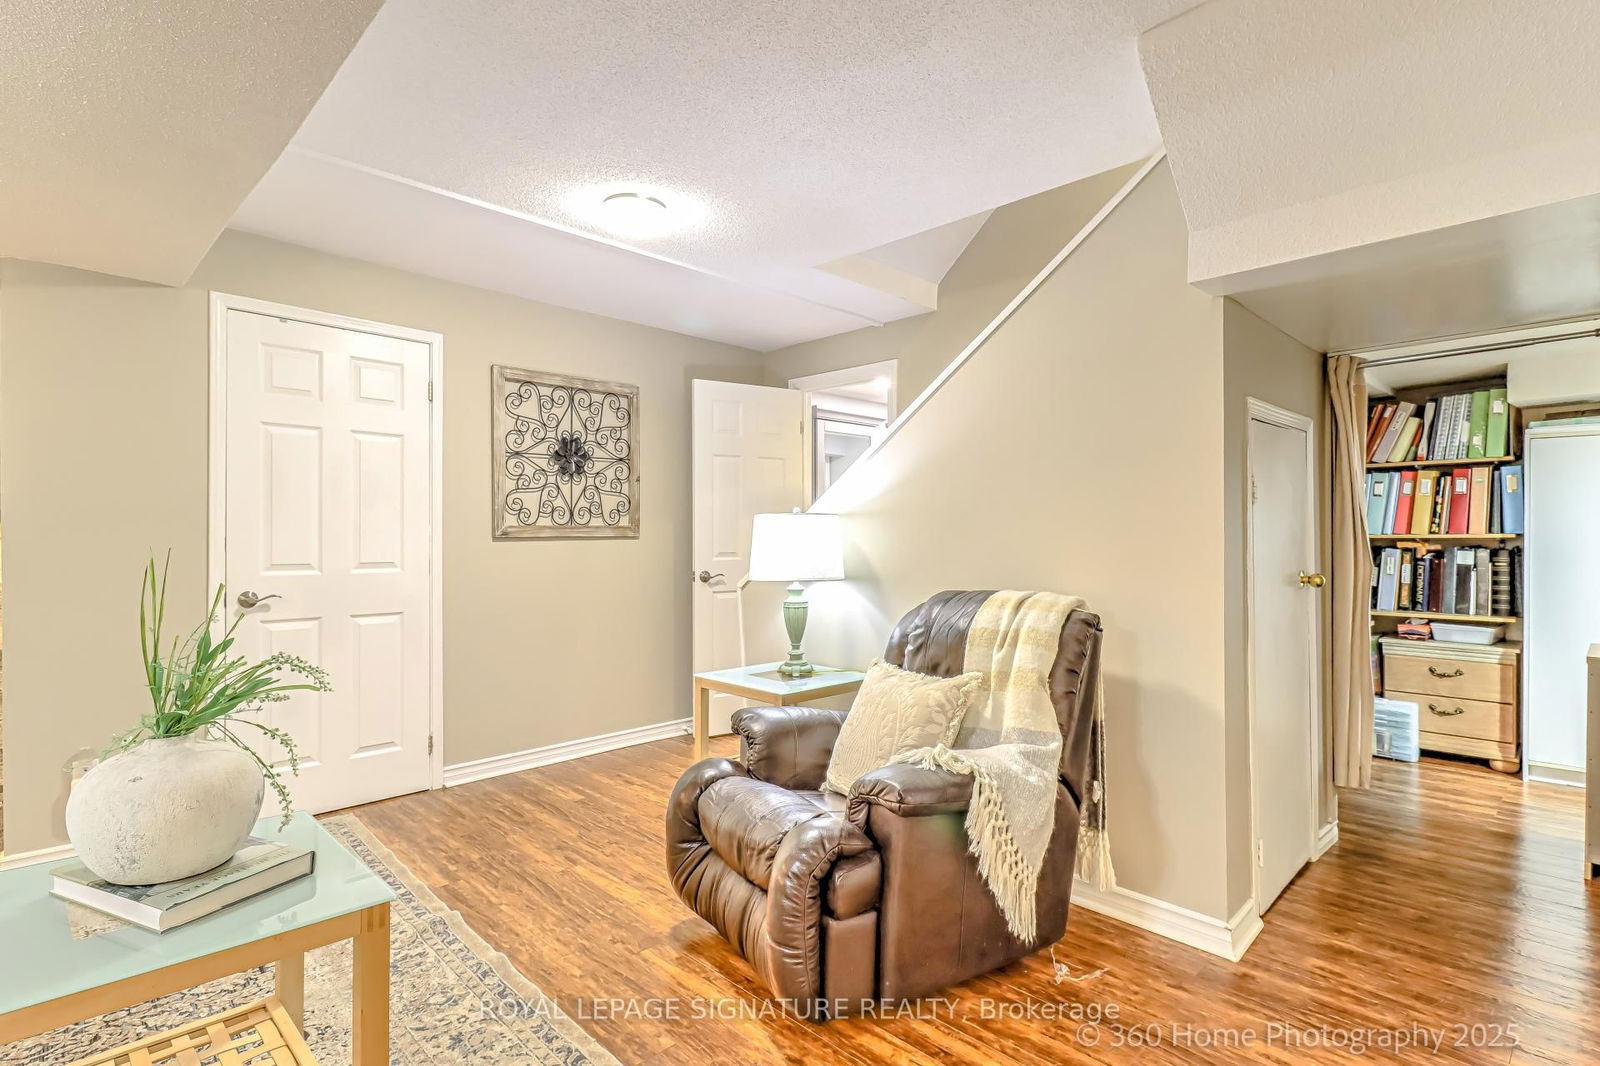
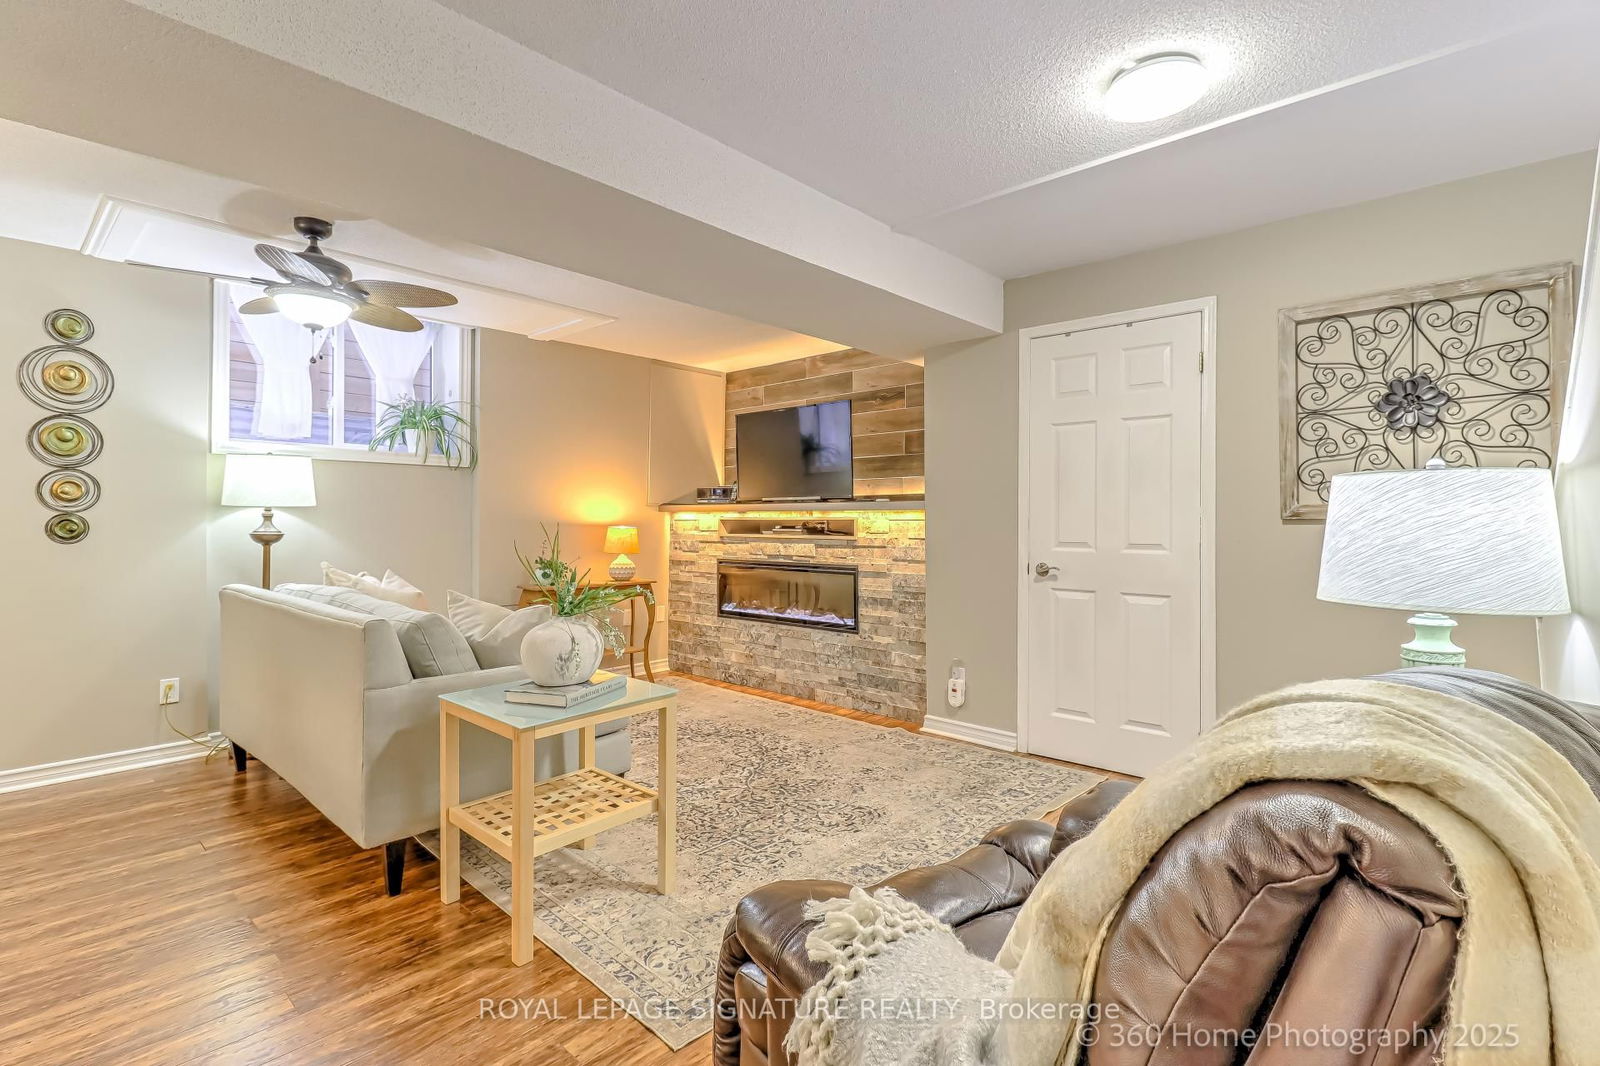
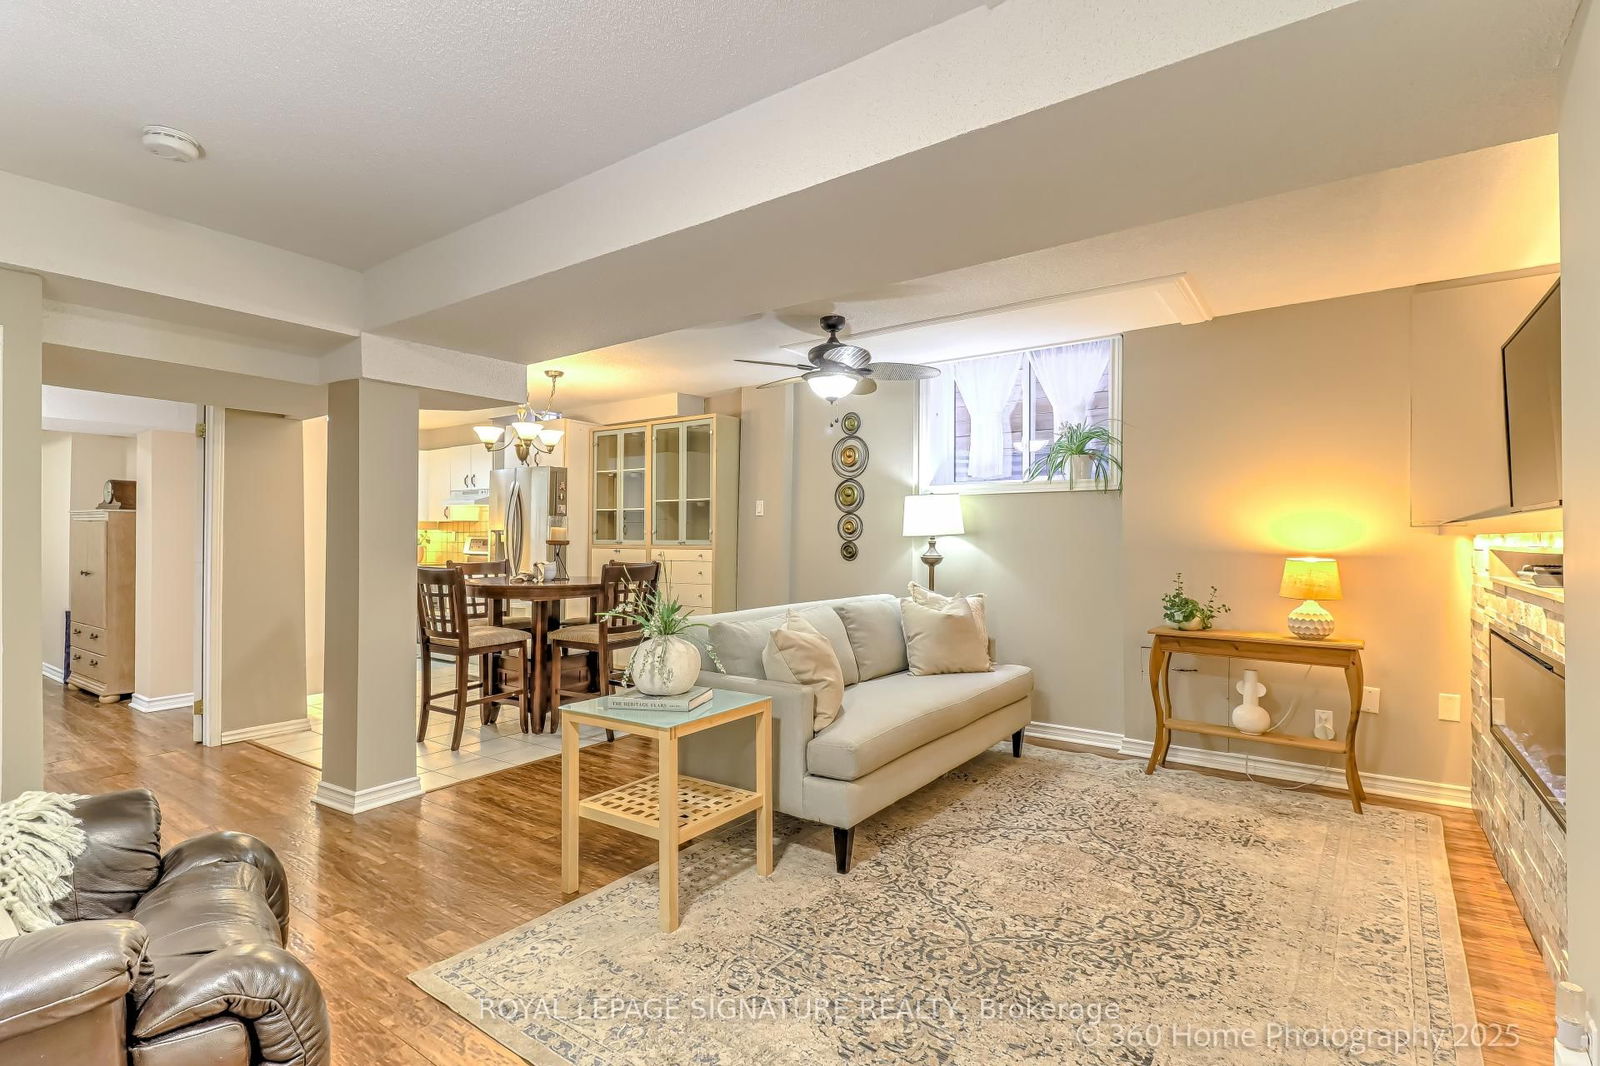
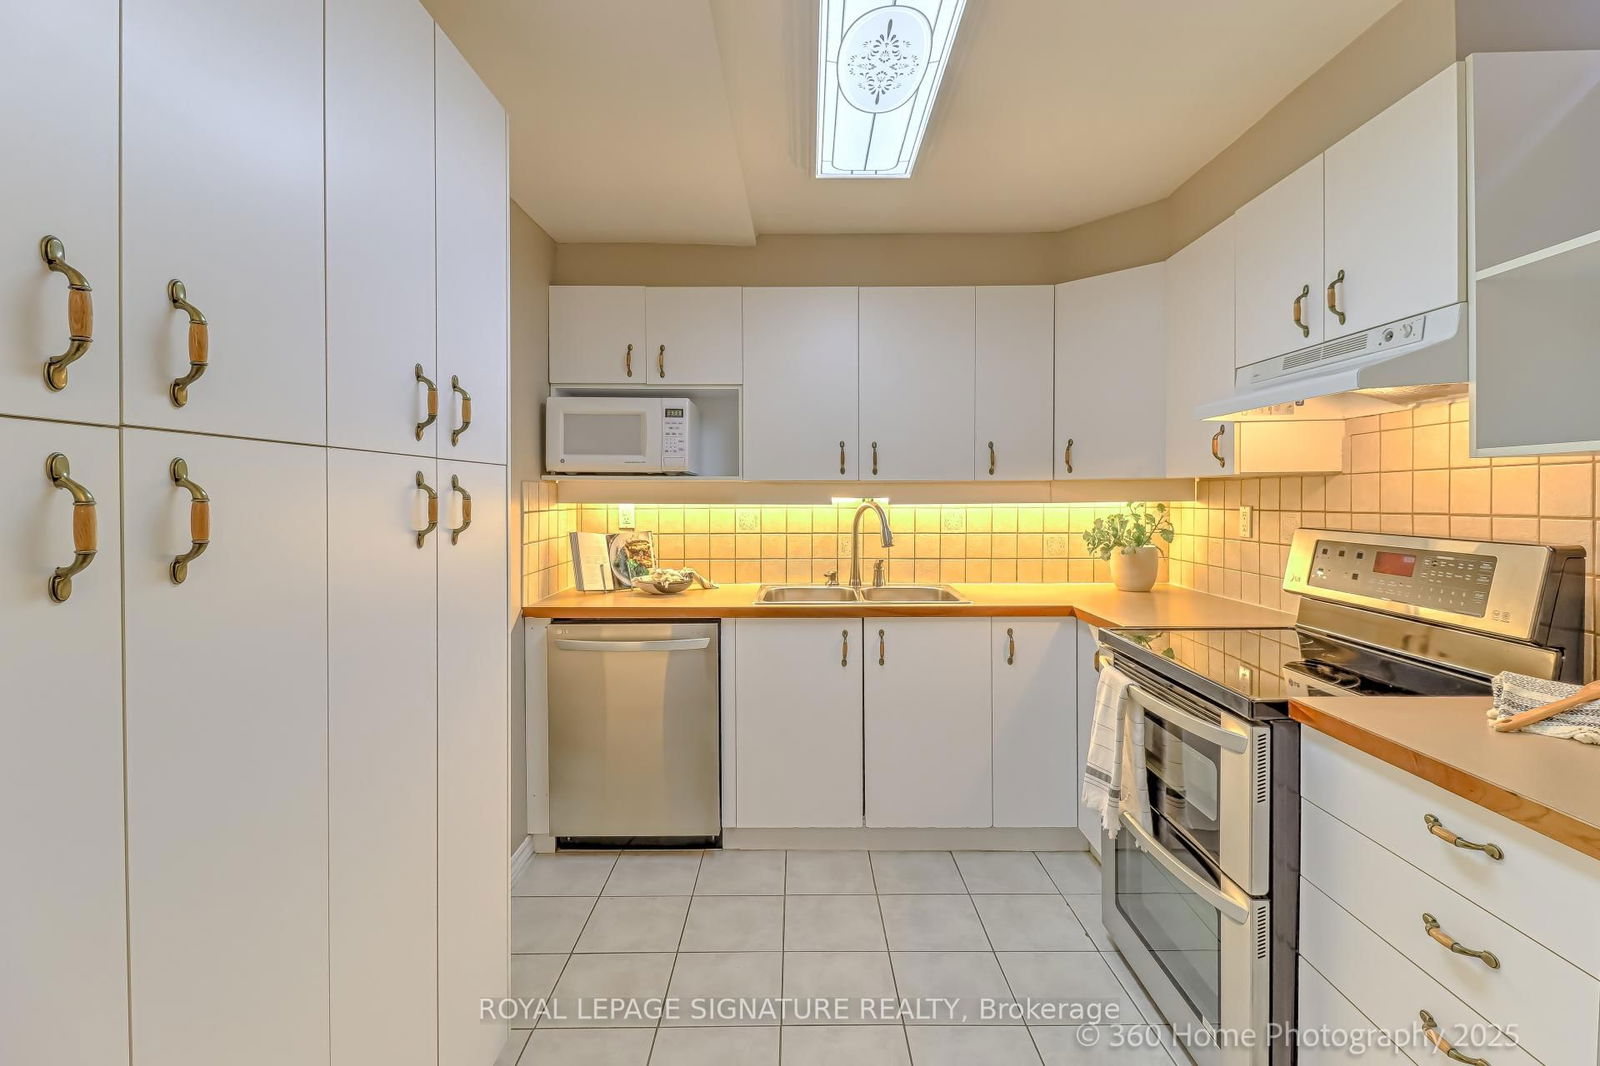
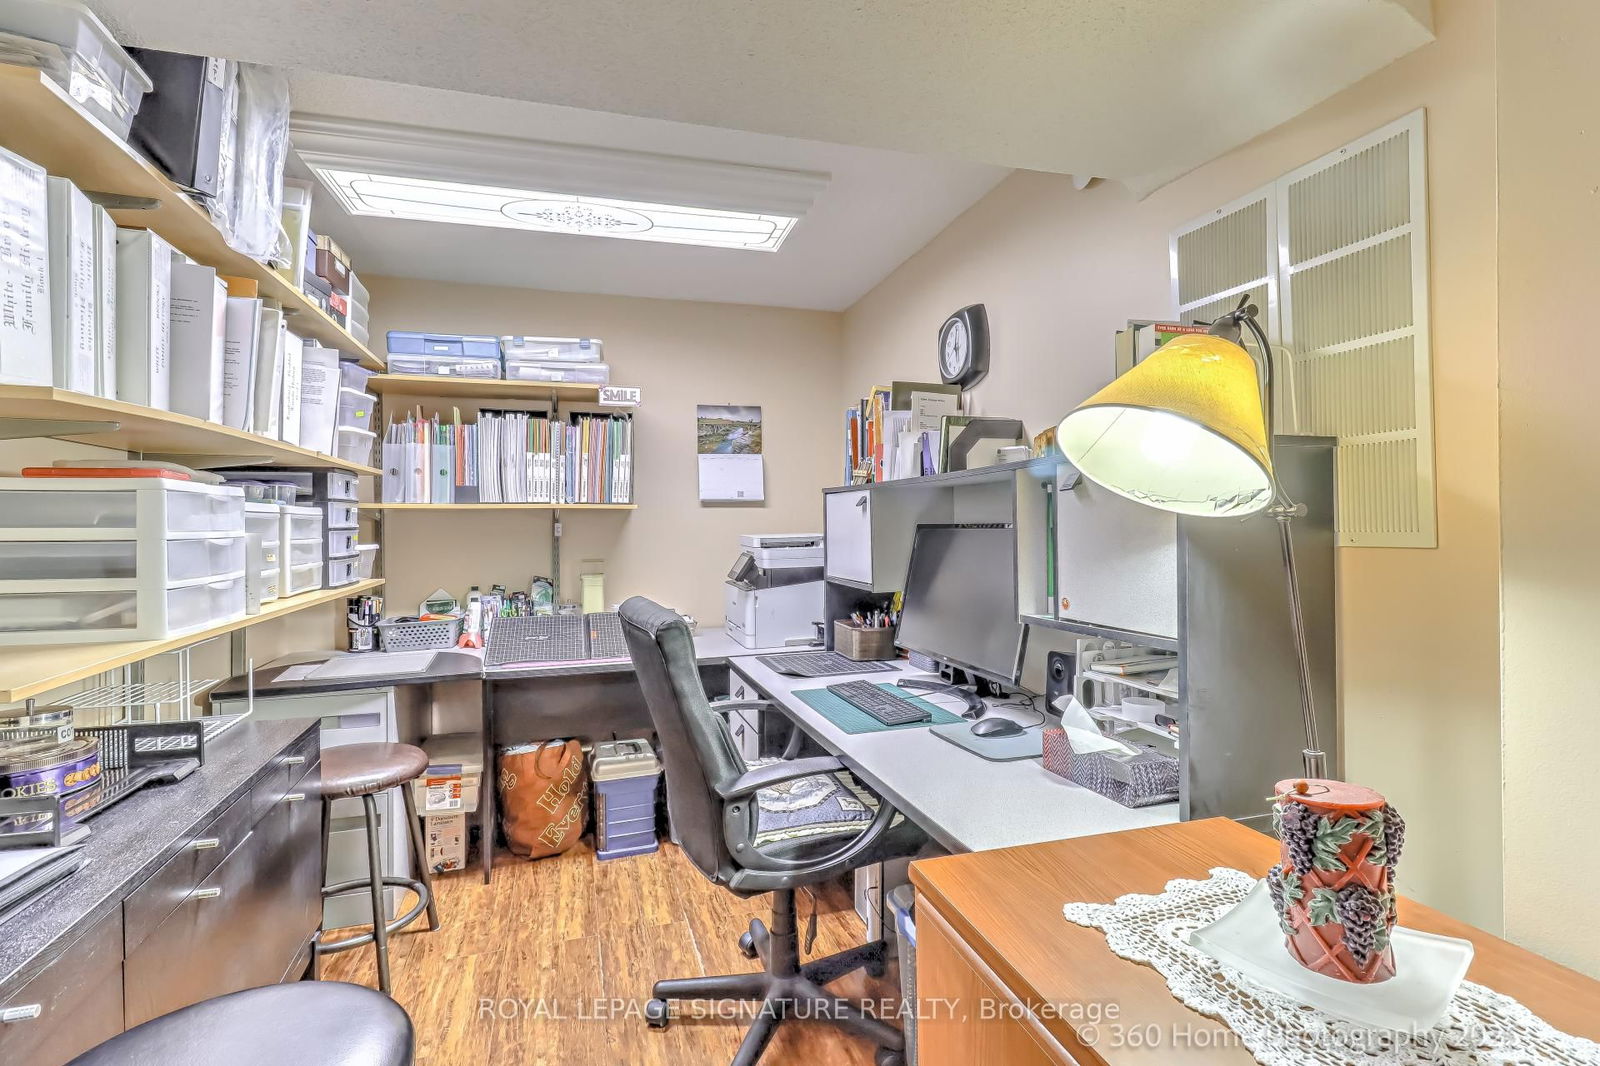
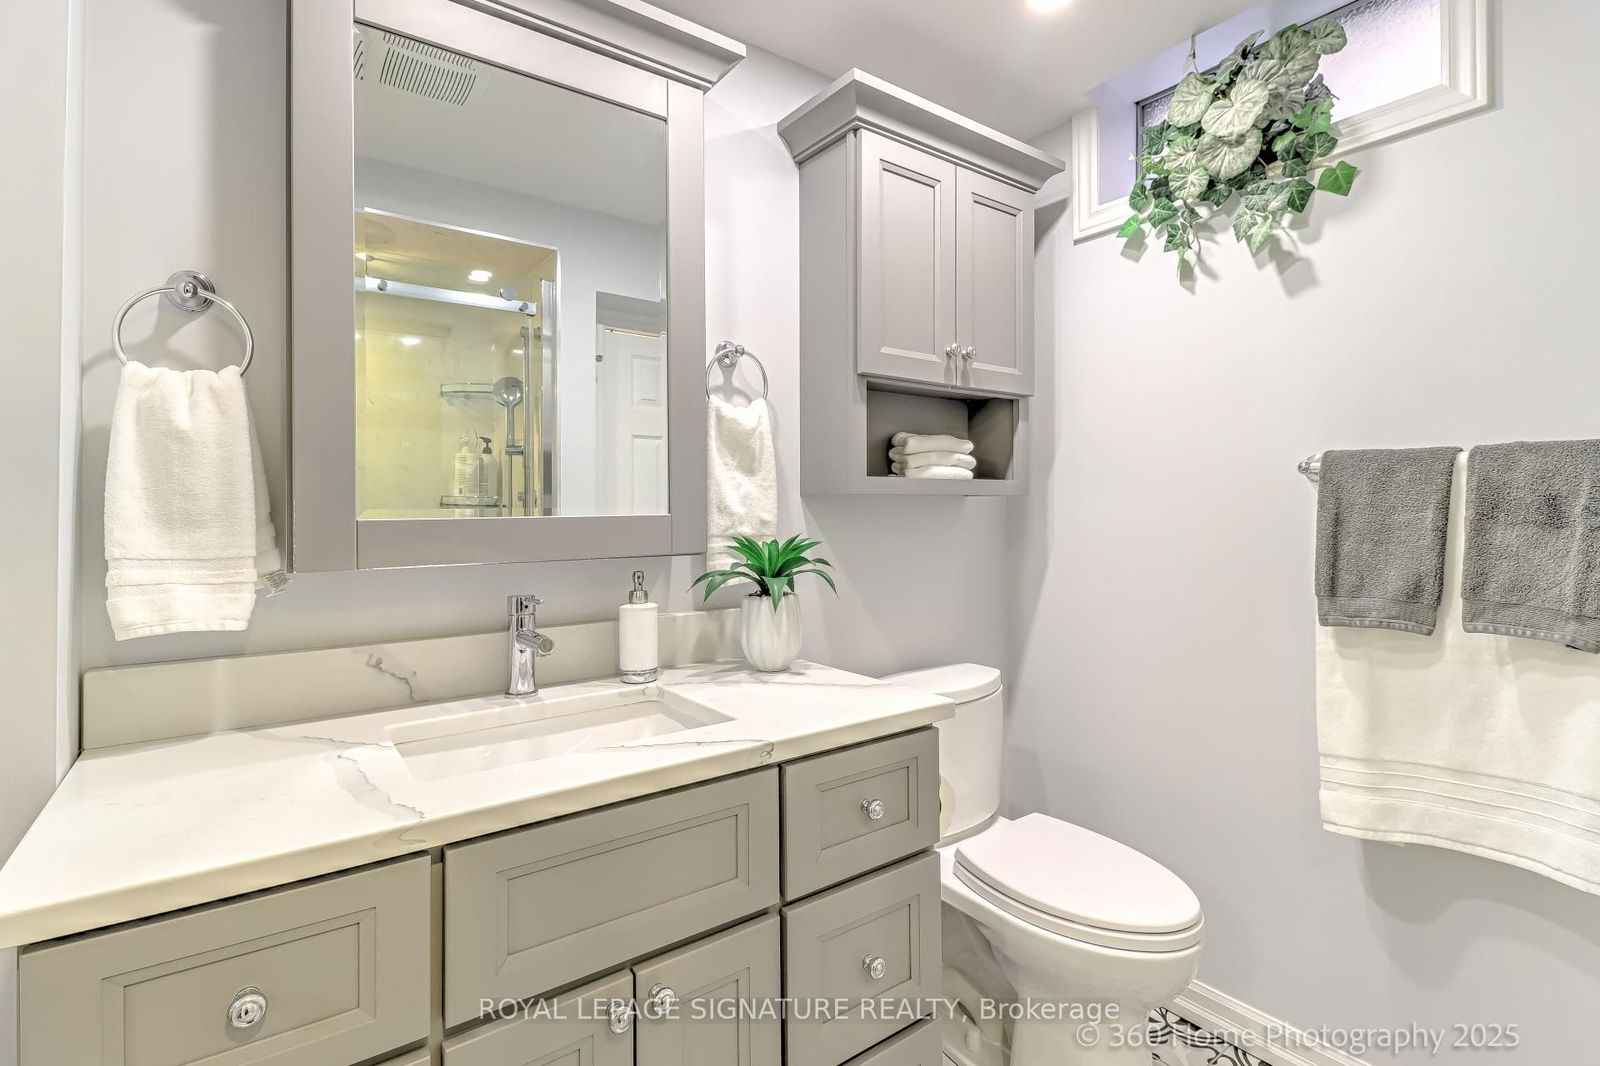
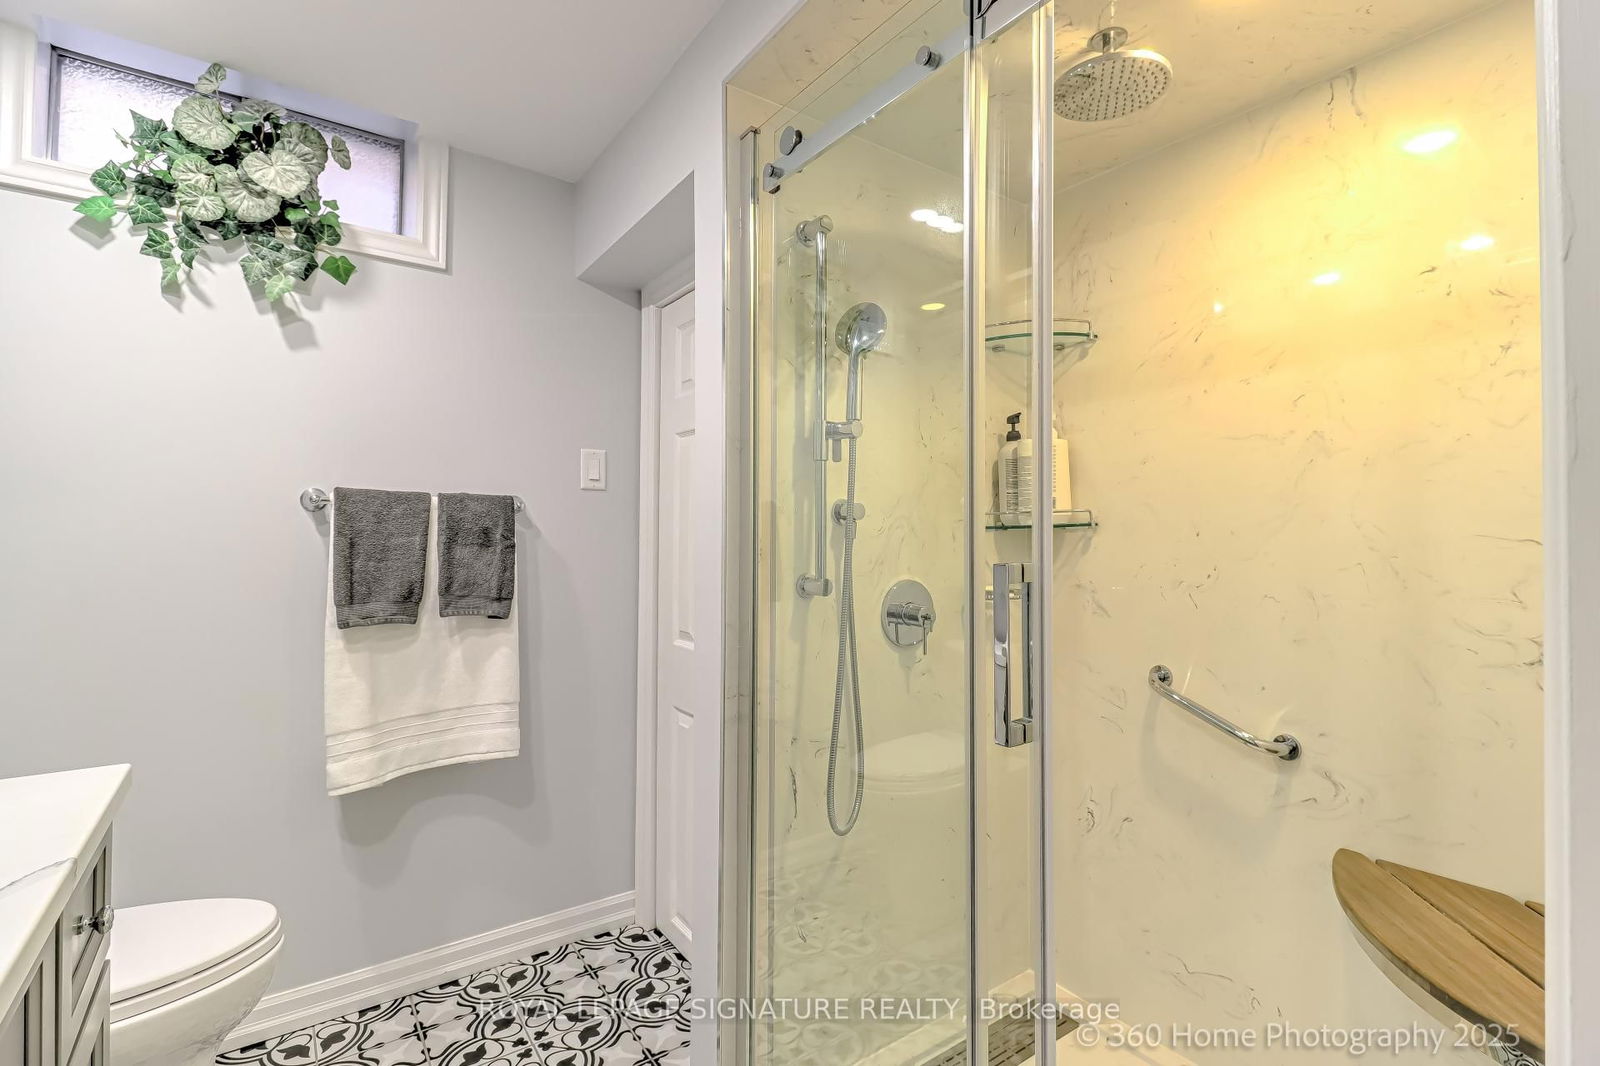
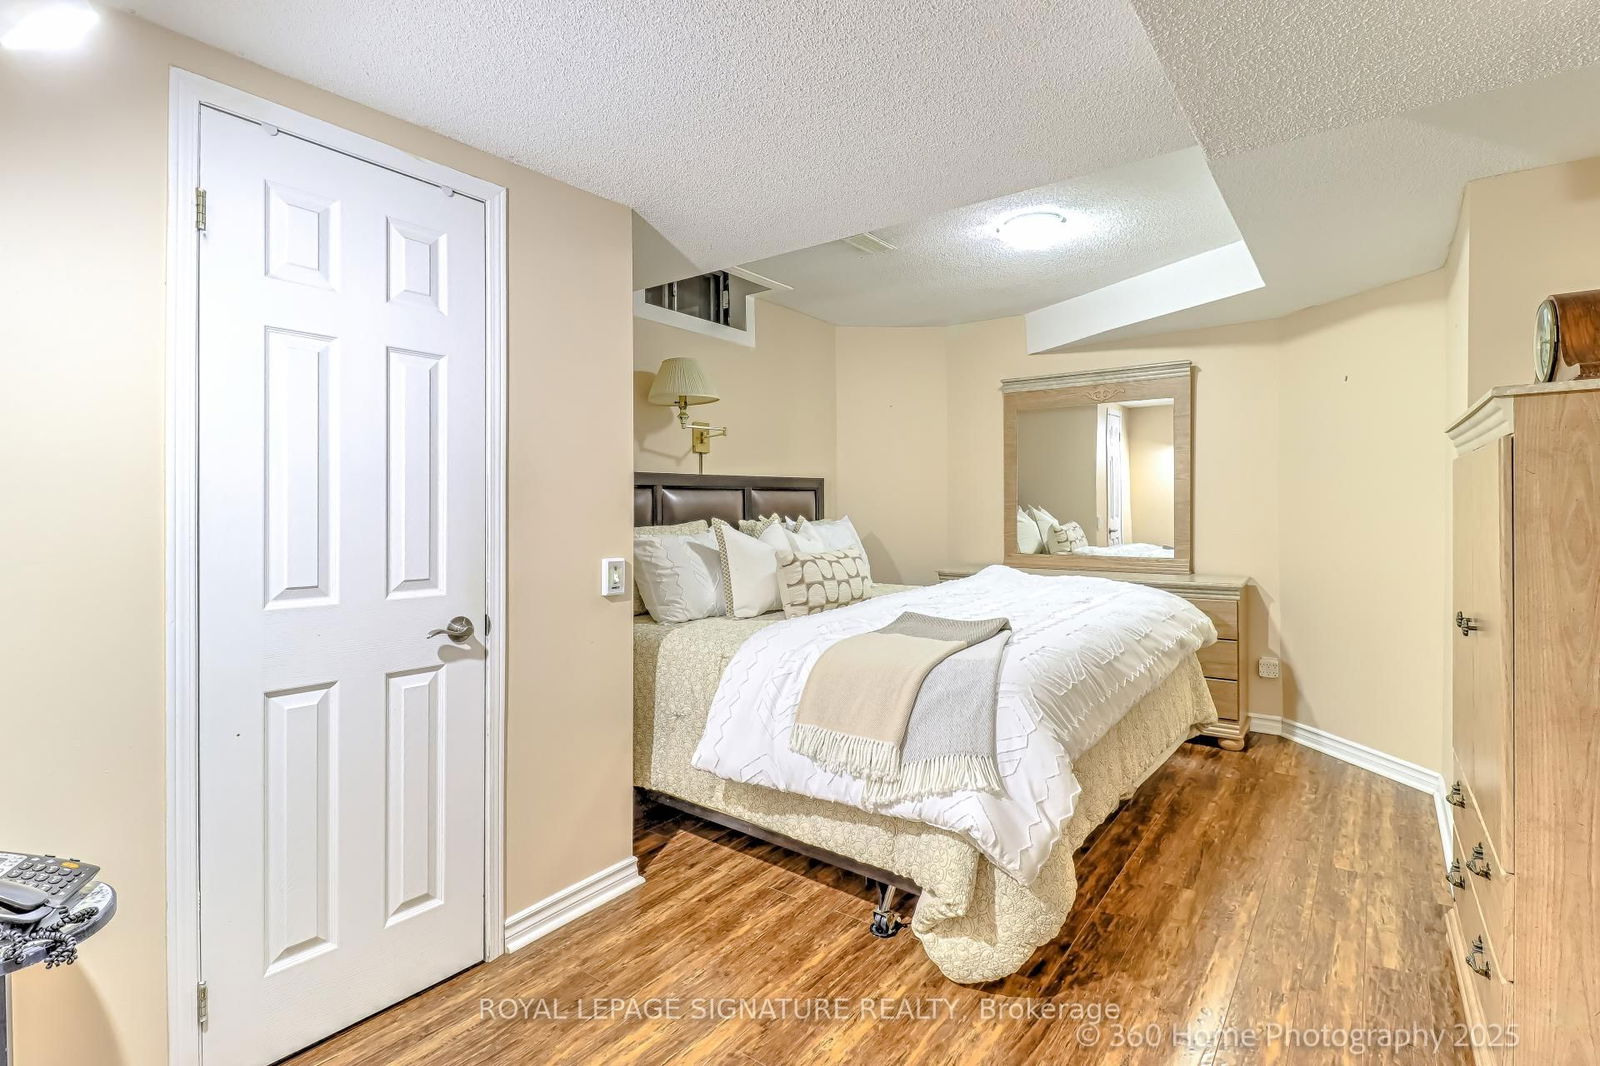
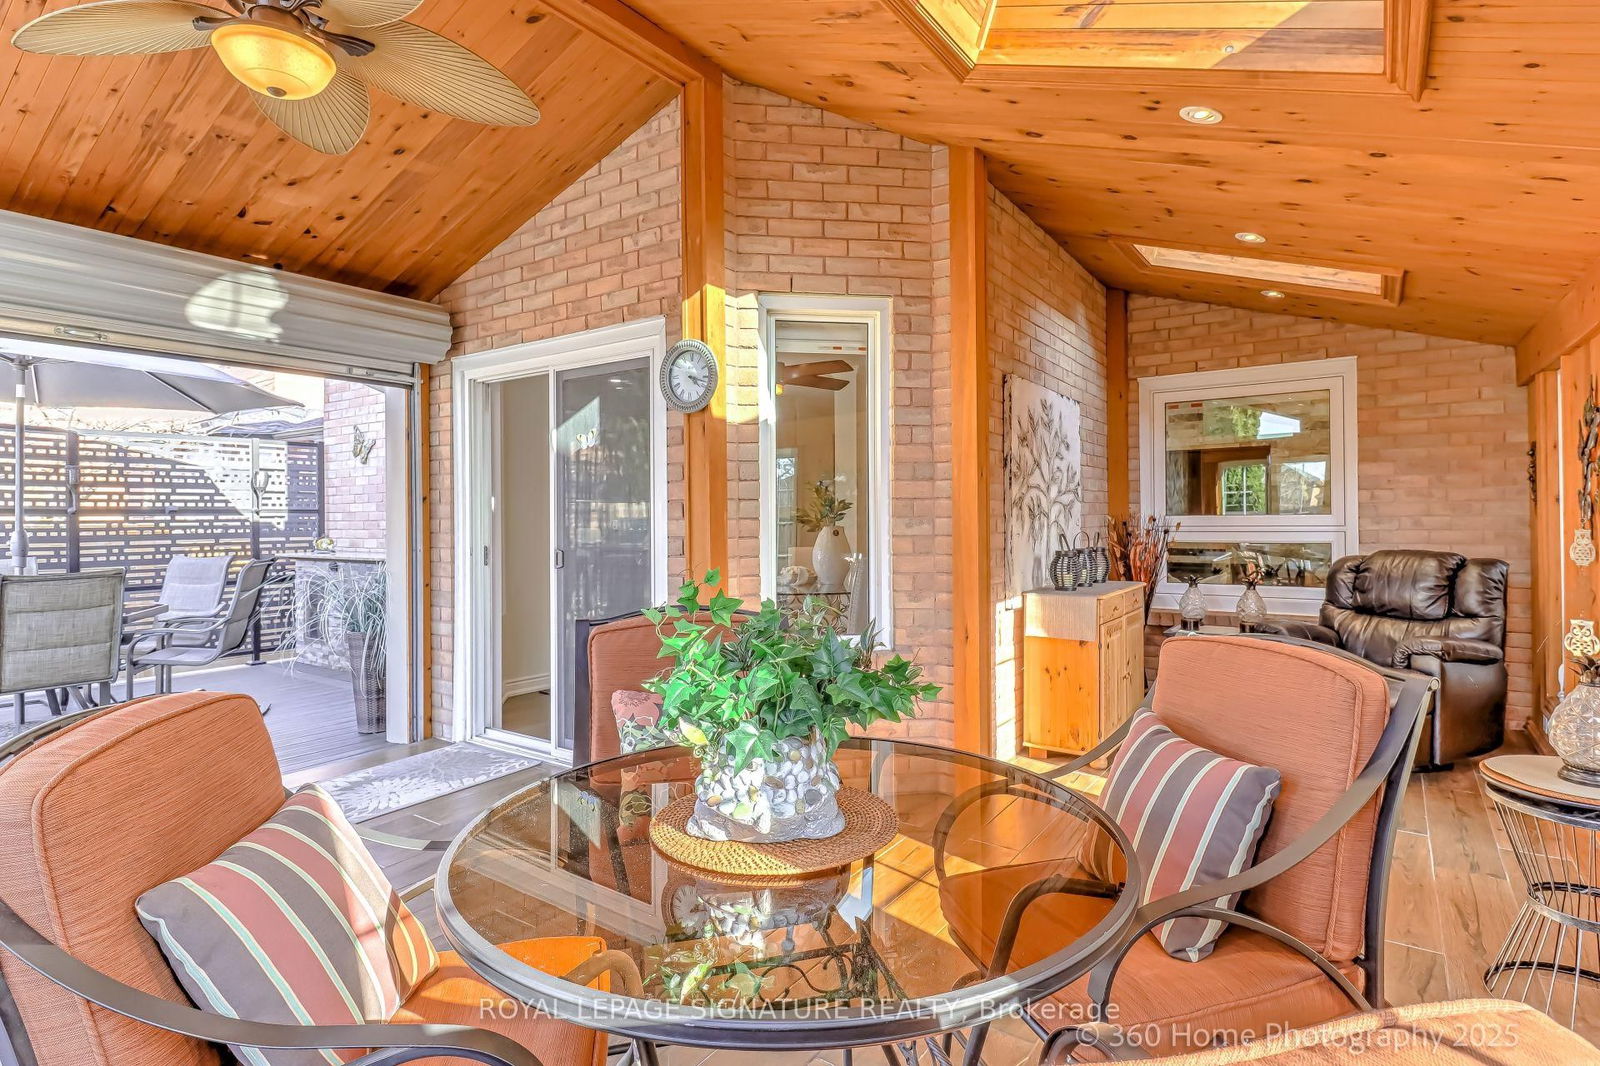
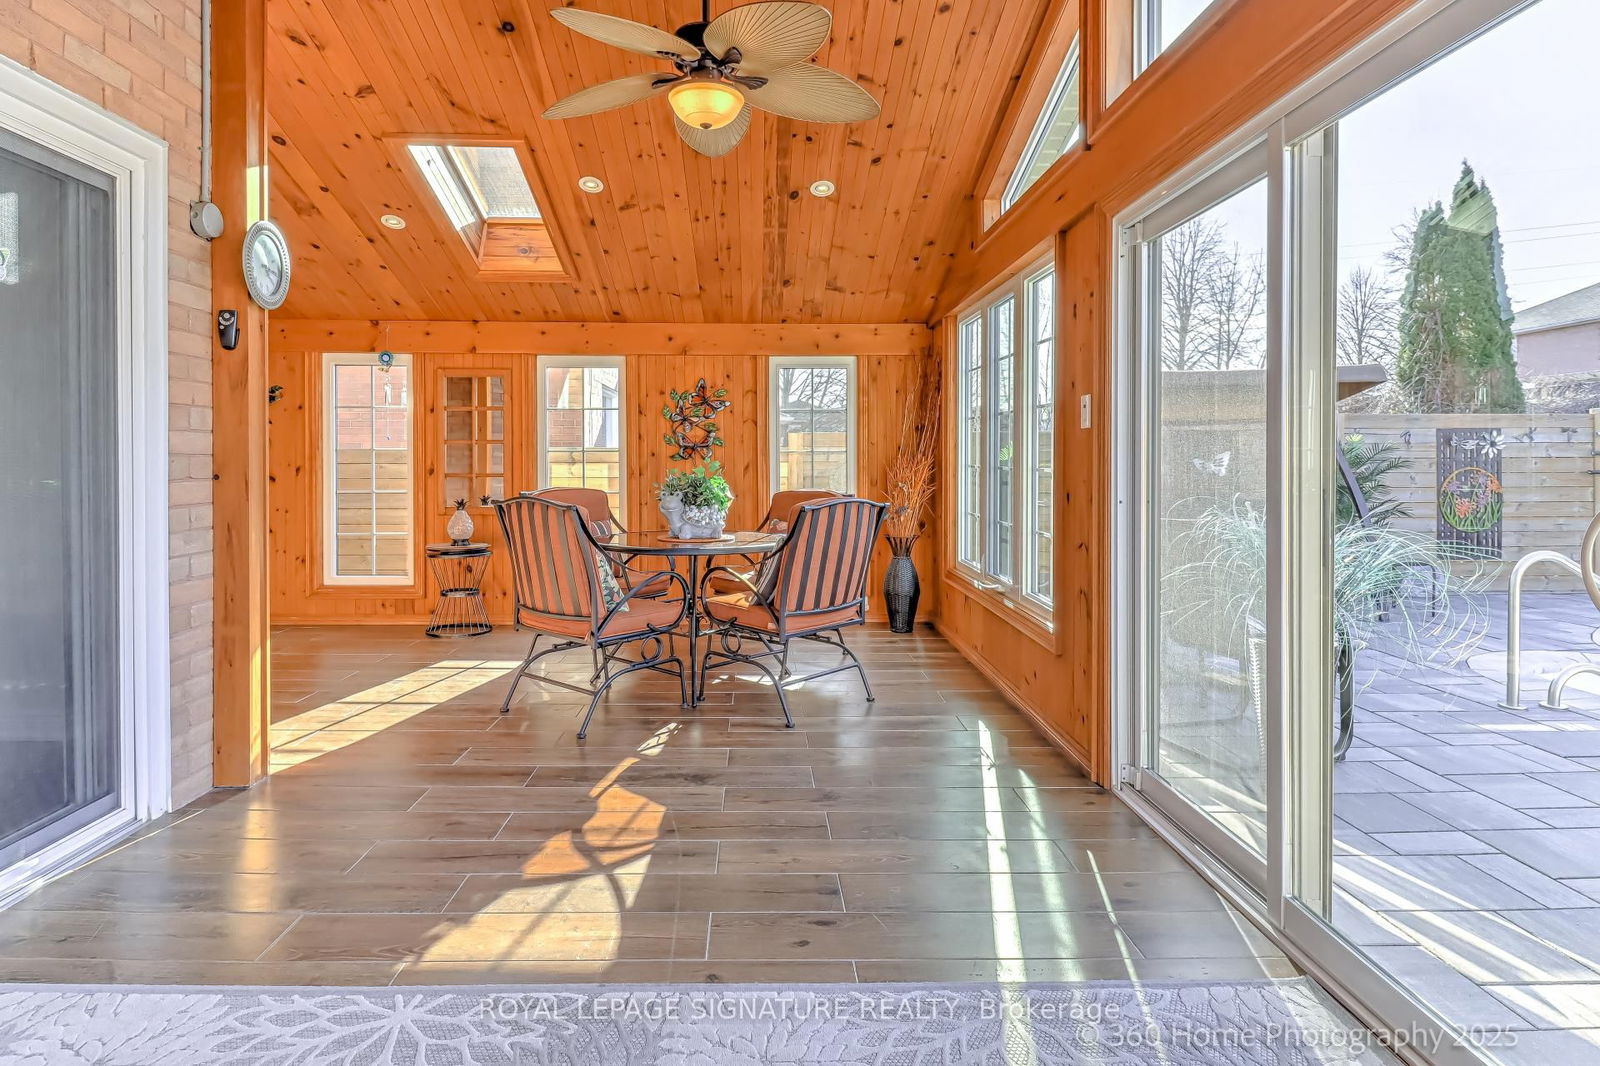
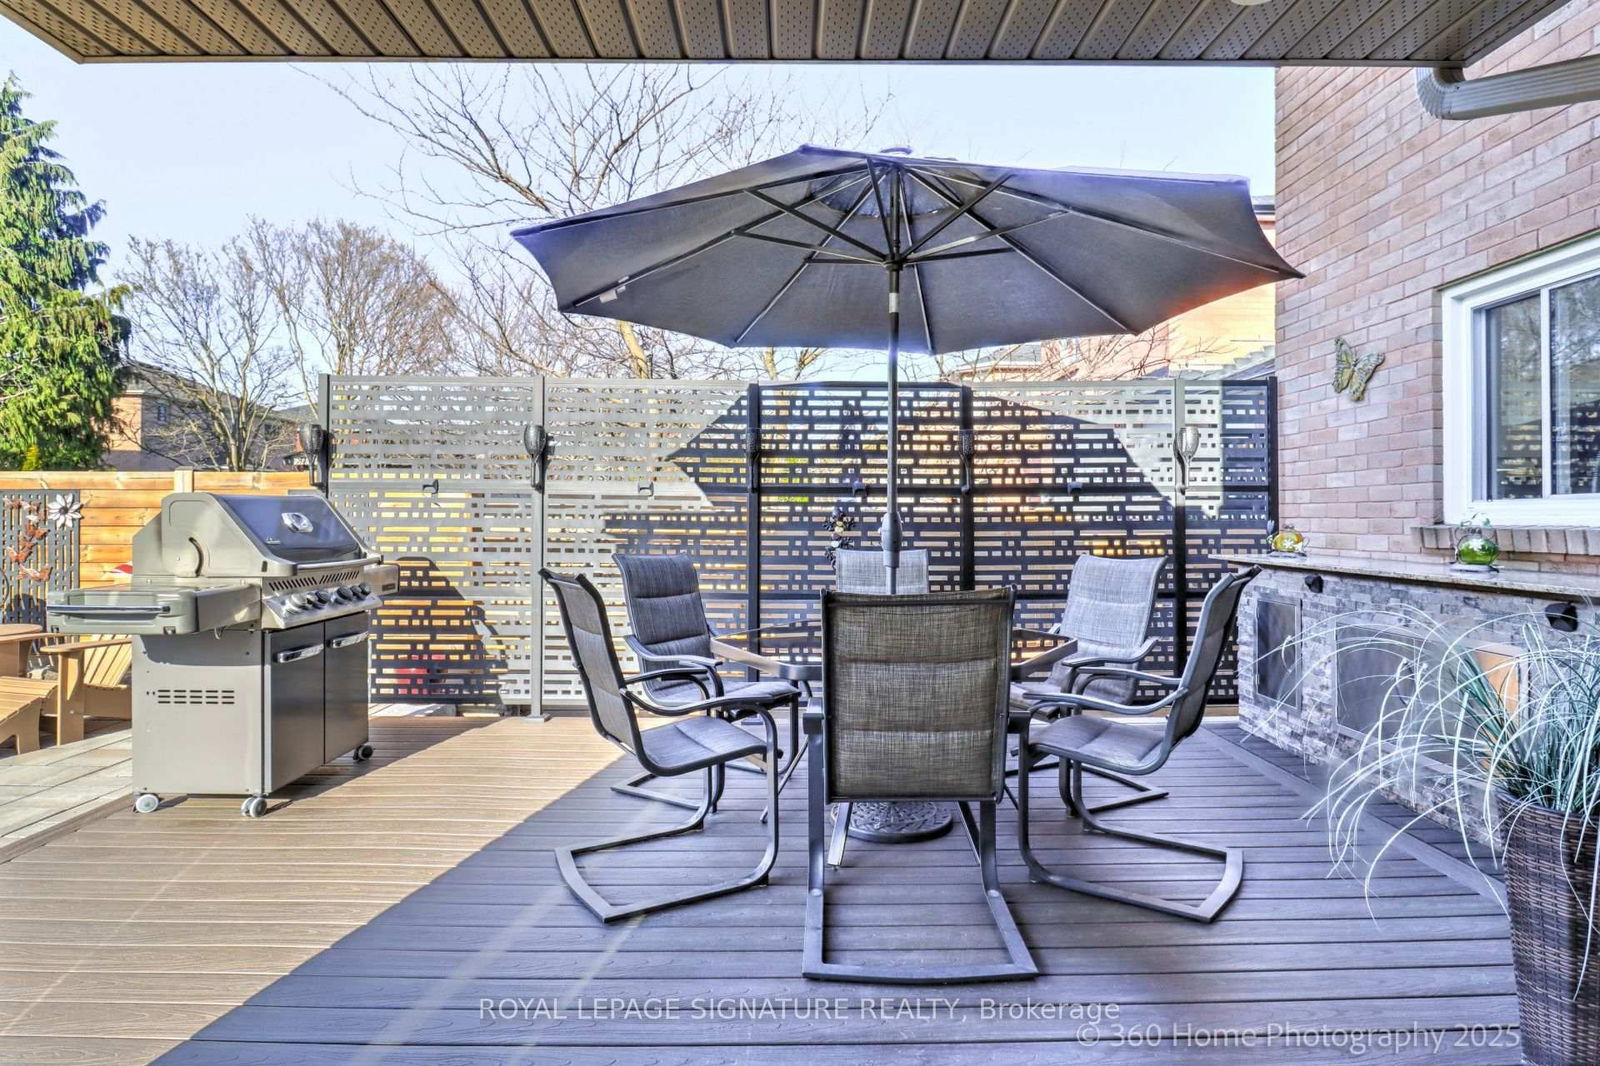
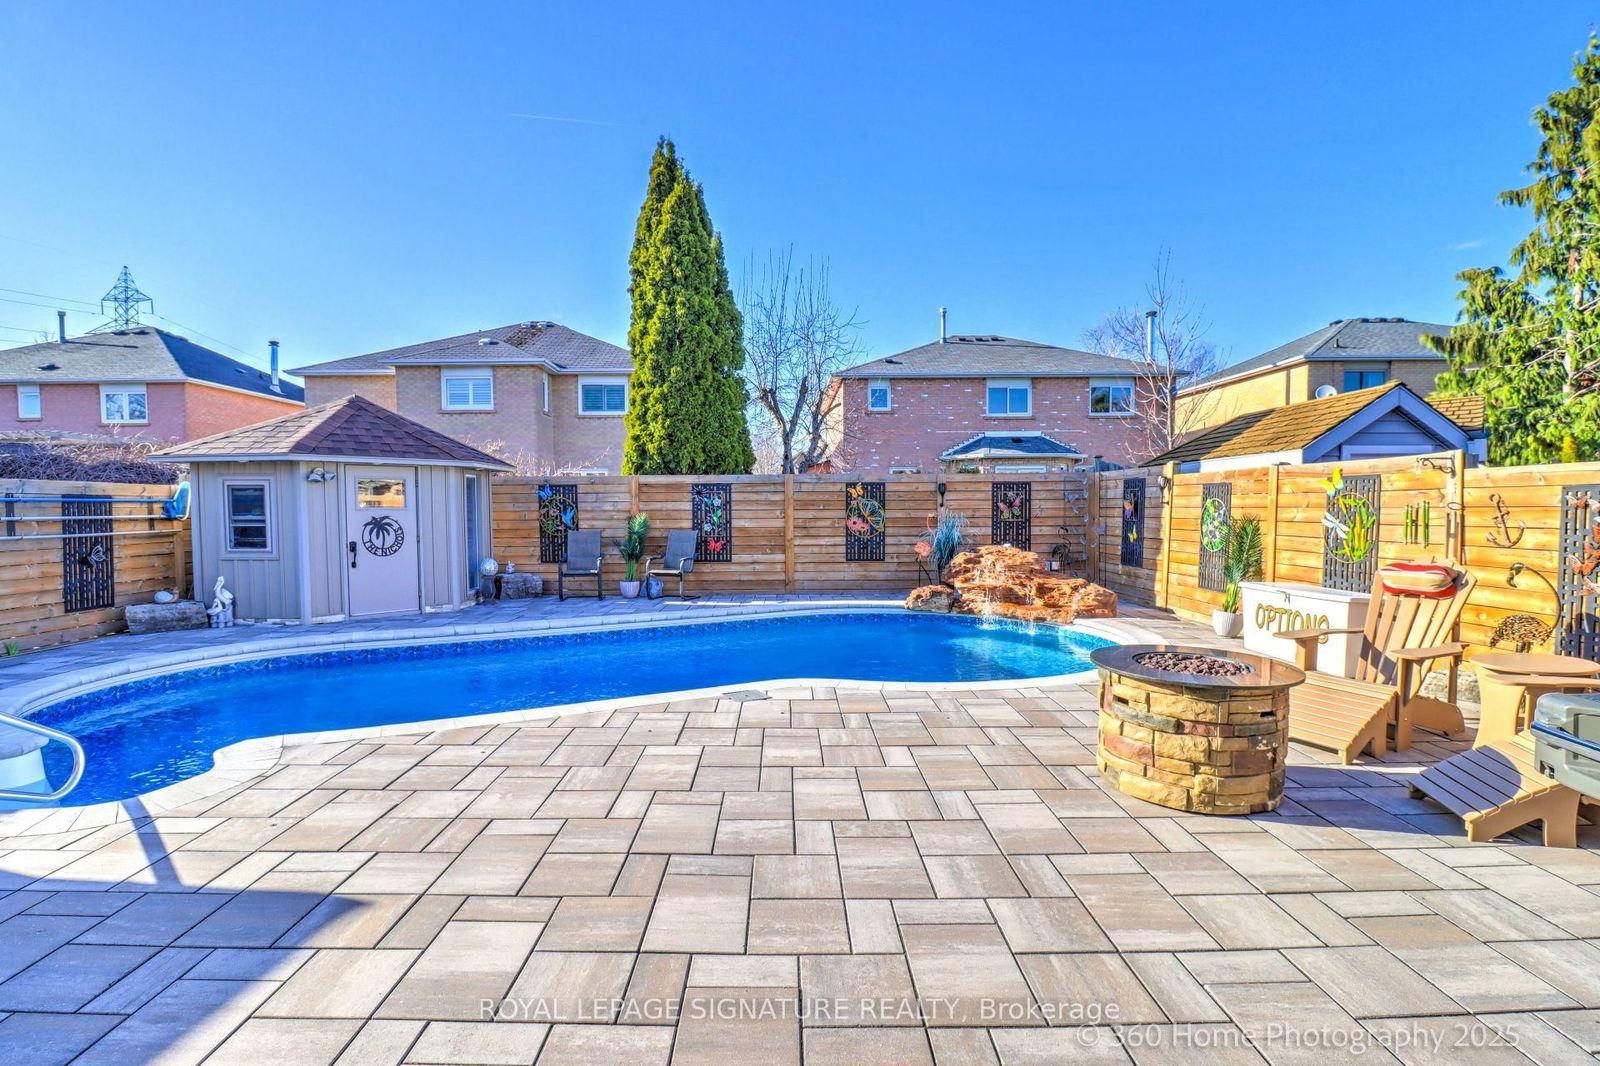
Opportunity knocks to own in one of north Whitby's most sought after and desirable communities, Rolling Acres! Situated by a park, ravine, walking trails and top ranked schools this enclave location is a rare find. Pride of ownership, no expense spared creating every detail, this immaculately maintained property is an entertainers delight! Over $400,000 invested in custom finishings and upgrades. This sun filled all brick 2 storey detach boasts 4+2 bdrm's, main floor family room, 4 walk-outs, 2 f/places, 2 bdrm in law suite with separate entrance+laundry access, 5 car total parking, customized heated interior double car garage with 400 sqft loft/office/storage space, backyard oasis retreat featuring custom interlocking stone,composite decking,Muskoka sun room w/pot lights+skylights, full privacy fencing, inground pool w/water falls, cabana, bbq area w/built-in counters+storage, spectacular outdoor space built for low maintenance! Wide plank hardwood flooring on main+2nd level, custom eat-in kitchen w/quartz counters, glass b/splash, SS appl's, cabinet lighting, pot lights galore thru-out home, multiple stone accent walls, b/in tv's, surround sound system, custom blinds, concrete and armour stone walkways and so much more. Too many upgrades to mention. Don't miss your chance to view this incredible offering located in this tranquil pride of ownership community enclave!
All blinds+window treatments, brdlm w/laid, Central air, SS dble door fridge, cooktop stove, B/in dishwasher, b/in microwave/fanhood, washer and dryer, fam room b/in tv+sound bar, liv rm mounted tv+7.1 surround sound system, 8 ceiling fans, bsmt fridge, dble convection oven stove, b/in dishwasher, tv, garden shed, garage door opener+remotes, garage heater, (garden accessories+furniture negotiable)
Foyer
Living
Dining
Kitchen
Family
Primary
2nd Br
3rd Br
4th Br
Kitchen
Living
Br
Br
The graph below compares the average list price and average sale price of homes in this neighborhood by month for the last 24 months. When average sale price is greater than average list price, this may suggest a buyer's market. When average sale price is lower than the average list price this may suggest a seller's market.
The graph below illustrates the average days on market for homes in this neighborhood. The yellow area may indicate a buyer's market, the green area may indicate a balanced market and the red area may indicate a seller's market.
Sales Representative, Century 21 People’s Choice Realty Inc., Brokerage
(647) 576 - 2100
Whitby, Blue Grass Meadows, L1N 8J7
Whitby, Blue Grass Meadows, L1N 6R1